

Table of Contents
Financial reporting has run on the same fundamental interface since Lotus 1-2-3 shipped in 1983: flat grids, two-dimensional charts, and static PDFs that demand hours of manual cross-referencing. For four decades, the tools improved incrementally, faster processors, better formulas, cloud collaboration, but the underlying visual paradigm stayed fixed. Rows and columns on a flat screen.
Augmented reality in accounting breaks that paradigm. AR overlays digital information onto the physical world through devices ranging from smartphones to spatial headsets, turning static financial data into three-dimensional, interactive models that accountants can manipulate with gestures, walk around, and share across remote teams in real time. The global AR market in enterprise applications reached $4.7 billion in 2025, according to Statista, and accounting workflows represent one of its fastest-growing vertical applications.
This guide covers how AR is reshaping day-to-day accounting work, where the technology delivers genuine value, and where it still falls short. The comparison table below frames what the shift actually looks like in practice.
| Feature / Task | Traditional Workflow (2D) | AR-Enhanced Workflow (3D Spatial) |
|---|---|---|
| Data Review | Scanning rows of numbers on a flat display. | Manipulating layered 3D graphs projected into physical workspace. |
| Inventory Audits | Manual counting with paper checklists. | Spatial mapping with real-time digital overlays via smart glasses. |
| Client Meetings | Walking through static 50-page PDF decks. | Guiding clients through interactive 3D financial models. |
Understanding Augmented Reality in Accounting
What AR Actually Does in a Financial Context
Augmented reality has been a consumer novelty for years, with Pokémon Go, Instagram filters, and furniture placement apps. But the core technology behind those products (including spatial tracking, object recognition, and real-time rendering) is now being applied to professional workflows where the density of numerical data makes traditional 2D interfaces a genuine bottleneck.
In an accounting context, AR places financial data into the physical space around the user. A balance sheet becomes a layered, three-dimensional model that an auditor can walk through rather than scroll across. Revenue streams appear as visual flows that surface anomalies the way a topographic map surfaces elevation changes, patterns that flatten into invisibility on a spreadsheet become obvious when rendered spatially.
The practical benefit is pattern recognition. Human visual processing is wired for spatial relationships, depth, and motion. When financial data is presented in three dimensions, accountants can identify outliers, seasonal trends, and category-level imbalances faster than they can by scanning tabular rows. This is the same principle that makes heat maps more readable than raw data tables, extended into a third dimension.
From Flat Spreadsheets to Spatial Visualization
The limitations of spreadsheet-based reporting are well-documented. Locating a specific variance in a complex multi-entity consolidation can take 20 minutes of manual filtering. Two-dimensional charts compress multivariable relationships into axes that obscure correlation. And prolonged screen time on dense numeric layouts contributes to what occupational health researchers call “spreadsheet fatigue”, a measurable decline in analytical accuracy after extended sessions.
Spatial visualization addresses these constraints by converting flat data into interactive 3D environments. With AR, a balance sheet becomes something you explore rather than read. Cost centers can be isolated by gesture, pulled apart to expose their sub-accounts, and traced back to source transactions through visual links. If you want to understand how a specific line item connects to the general ledger, you literally follow the trail.
This does not mean spreadsheets disappear. The underlying data structures remain tabular. AR functions as a visualization layer on top of the existing accounting stack, one that makes complex financial relationships accessible without requiring the user to hold the entire structure in working memory.
Choosing the Right Device for the Job
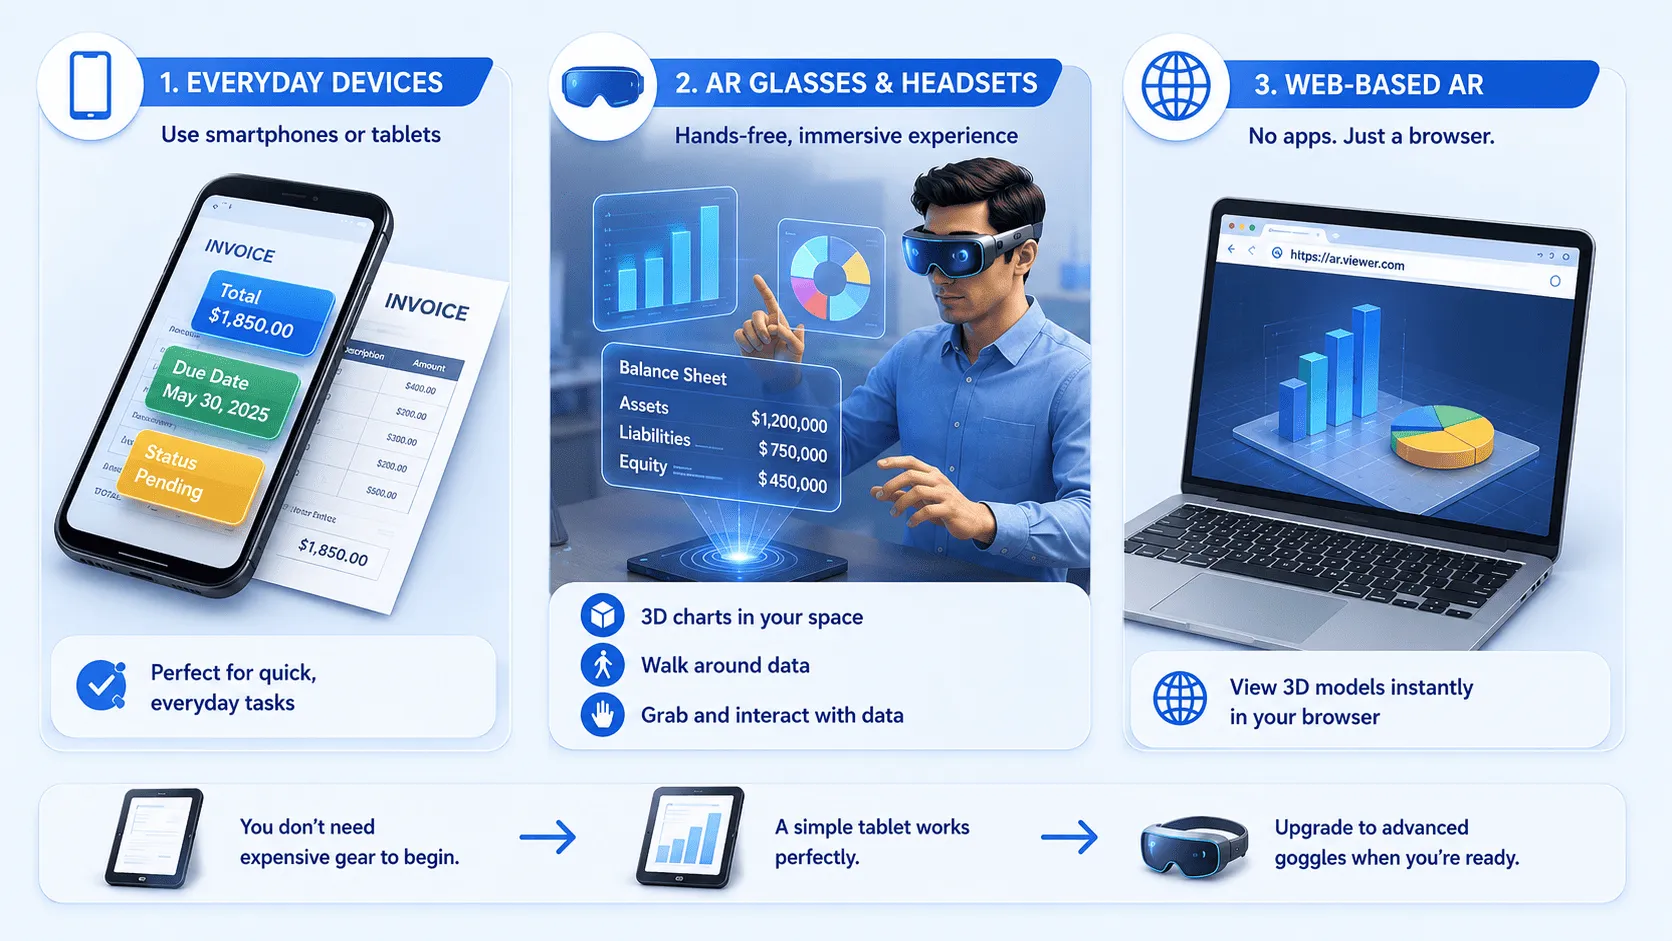
The AR hardware landscape for accounting firms breaks into three tiers, each suited to different use cases and budget constraints.
Smartphones and tablets represent the lowest barrier to entry. Most modern iOS and Android devices support ARKit or ARCore natively, which means firms can deploy basic AR applications (such as pointing a phone camera at a paper invoice to extract and verify data in real time) without purchasing any new hardware. For small and mid-sized practices running quick on-site inventory checks or client-facing data demos, mobile AR is often sufficient.
Mid-range headsets like the Meta Quest 3 offer a hands-free experience with passthrough cameras that blend digital overlays with the user’s physical environment. These devices are practical for extended audit sessions where the accountant needs both hands free to handle physical documents while viewing digital annotations, though battery life typically caps at 2 to 2.5 hours of continuous use.
Premium spatial computing headsets, including the Apple Vision Pro and Microsoft HoloLens 2, target enterprise deployments. These devices use high-fidelity spatial passthrough, cameras capture the physical room, and the headset projects 3D data models directly into that space, allowing the user to interact with financial visualizations using hand tracking and eye gaze. The price point is steep, but for large firms running immersive client presentations or multi-team strategy sessions, the fidelity justifies the cost.
Web-based AR is also emerging as an option. Browser-based 3D rendering (using frameworks like WebXR) allows users to view spatial financial models without installing dedicated software, a lower-friction entry point, though with reduced interactivity compared to native applications.
The Software Stack: Platforms, SDKs, and Integration Partners
The AR software layer in accounting typically sits between the firm’s core financial platform and the visualization front end. Enterprise resource planning systems, SAP S/4HANA, Oracle NetSuite, Workday, and QuickBooks Advanced serve as the data source. The AR application pulls data from these systems via APIs, transforms it into 3D-renderable formats, and pushes it to the user’s device.
On the development side, Google ARCore and Apple ARKit provide the foundational SDKs for building spatial applications on Android and iOS, respectively. Custom accounting-specific AR solutions are being built by firms such as Trantor (which focuses on enterprise AR integrations for financial workflows) and Seisan (which specializes in spatial data visualization). Major consultancies, including Deloitte and EY, have invested in internal AR capabilities for audit and advisory services, though published details on their specific implementations remain limited.
The technology still carries structural limitations that firms should weigh honestly.
Implementation costs are substantial. A full headset deployment for a 10-person audit team, hardware, software licensing, and custom integration with existing ERPs, can easily reach $50,000 to $100,000, depending on device tier and platform complexity. Training represents an additional time cost; most firms report a 4-to-6-week onboarding period before staff reach comfortable proficiency with spatial interfaces. And without established industry standards for AR-based financial reporting, each firm must develop its own internal protocols for data handling, security, and compliance, particularly around GDPR and SOC 2 requirements. For firms operating under structured professional development frameworks, including CPA CPD requirements that distinguish verifiable from non-verifiable learning, AR training programs designed around documented, structured scenarios can qualify as verifiable hours in a way that informal shadowing typically cannot.
Daily Applications: Where AR Creates Measurable Value
Accounting firms are deploying AR across three primary workflow categories. The technology is most mature in auditing and asset verification, and at the earliest stage in client-facing presentations.
Spatial Dashboards and Financial Data Visualization
AR-powered dashboards project client financial data into the accountant’s physical workspace as interactive 3D models. Instead of toggling between tabs in a flat reporting tool, the user works with a spatial layout where revenue, expenses, and balance sheet items occupy distinct visual layers that can be rearranged, filtered, and drilled into by gesture.
The practical advantage is simultaneous visibility. In a 2D dashboard, comparing data across four different views typically means switching screens or tiling windows. In a spatial dashboard, all four views can exist at once in the user’s peripheral vision; the accountant turns their head to shift focus rather than clicking between tabs. For multi-entity consolidations or portfolio-level reviews, this reduces the cognitive load of holding multiple data contexts simultaneously.
Document Processing and Automated Verification
Paper invoices, receipts, and physical contracts remain common in accounting, particularly for smaller clients or international transactions. When financial statements or transaction records arrive as static PDFs, tools like PDF to CSV can also help accountants turn that information into structured spreadsheet data for reconciliation, review, or reporting AR streamlines document processing by using the device camera (whether phone, tablet, or headset) to scan physical documents, extract key data fields through optical character recognition, and cross-reference the extracted values against the firm’s existing records, all in a single visual pass.
The system highlights discrepancies directly on the document view. If an invoice total doesn’t match the purchase order on file, the mismatch appears as a visual flag overlaid on the scanned paper. This makes the verification process faster and harder to miss, though it depends on clean OCR accuracy; handwritten documents or poor-quality prints still trip up most current implementations.
On-Site and Remote Auditing with AR Overlay Verification
Auditing is the most developed use case for AR in accounting, and the one with the clearest return on investment. The application is straightforward: auditors use AR-equipped devices to scan physical inventory or assets, and the system overlays digital tags, including item identifiers, quantities, last-audit dates, and discrepancy flags, directly onto the physical items in real time.
AR-driven spatial mapping transforms the audit walkthrough. As the auditor moves through a warehouse or facility, the system maps the environment and attaches real-time asset tags to physical objects. Instead of cross-referencing a paper checklist against physical shelf locations, the auditor sees the data where the item actually sits. Missing items, quantity mismatches, or untagged assets surface immediately.
Remote auditing capabilities extend this further. A field auditor wearing AR glasses can share their spatial view with remote team members, who see the same overlaid data and can annotate specific items or flag concerns without visiting the site. Early adopters report roughly 30% faster audit completion using AR-assisted spatial mapping, though published independent benchmarks remain limited, most of that figure comes from vendor case studies rather than peer-reviewed research.
The reduction in documentation gaps is where firms see the most consistent improvement. Because the AR system logs every scanned item with timestamp, location, and verification status, the audit trail is generated automatically rather than compiled manually after the fact.
Underutilized AR Applications in Accounting
Beyond the core workflow categories, AR has several applications that most firms haven’t explored yet.
Location-Aware Data Retrieval During Physical Audits
Standard AR audit tools tag individual items. More advanced implementations tie into the facility’s spatial map to provide location-based data on demand; the system knows not just what you’re looking at, but where you’re standing relative to the entire inventory layout.
This allows auditors to pull up zone-level summaries, compare adjacent storage areas, and sync their position with interactive facility maps. For large-scale warehouse audits (including retail distribution centers or pharmaceutical storage facilities), location-aware AR reduces the time spent navigating between sections and cross-referencing location codes manually.
Staff Training and Simulation-Based Onboarding
Traditional orientation programs, slide decks, recorded walkthroughs, and shadowing sessions struggle with retention. AR-based experiential training places new hires directly into simulated audit or data-entry environments where they practice against realistic scenarios before touching live data.
PwC’s 2022 study on VR-based training found that immersive learners completed training four times faster than classroom learners and demonstrated 275% higher confidence when applying skills afterward. While that study focused on VR rather than AR specifically, the underlying principle, spatial, hands-on practice outperforms passive instruction, applies to both modalities. Firms using AR-based audit simulations report that new staff reach baseline competency faster, though the upfront cost of building custom training scenarios remains a barrier for smaller practices.
Shared 3D Collaboration Across Distributed Teams
The remote work default since 2020 has been video calls and screen sharing, functional but flat. AR collaboration tools allow distributed team members to gather around the same three-dimensional data model, regardless of physical location.
Each participant sees the same spatial visualization and can point to specific data points, rotate views, or annotate items that persist for all participants. For multi-office firms reviewing complex consolidations or M&A financial models, shared 3D workspaces reduce the back-and-forth that typically accompanies screen-share-based data reviews. Travel cost savings are a secondary benefit, though the more meaningful gain is decision velocity; teams that can jointly manipulate data in real time reach consensus faster than teams passing screenshots back and forth.
The Strategic Business Impact on Accounting Firms
Accuracy and Pattern Recognition
The core value proposition of spatial financial data is error detection. Anomalies that blend into rows of numbers on a flat screen become visually obvious when data is rendered in three dimensions. An unusual spike, an out-of-pattern variance, and a category-level imbalance all stand out the way a pothole stands out on a smooth road.
Pattern recognition improves because the human visual system processes spatial relationships more efficiently than it processes tabular abstractions. A 3D revenue model that shows Q3 dipping relative to adjacent quarters is more immediately legible than the same information expressed as a percentage change in a cell. For financial forecasting, this means accountants can identify emerging trends and test alternative scenarios by manipulating spatial models rather than re-running spreadsheet formulas, a workflow that is faster and, critically, more intuitive for stakeholders who aren’t trained in financial analysis.
Client Engagement and Presentation Quality
Most clients don’t have the financial literacy to parse a traditional audit report or a dense P&L statement. They nod through presentations because asking for clarification feels awkward, not because they understand the numbers.
AR changes this dynamic. Instead of presenting 50-page PDF decks, firms can walk clients through tangible, interactive 3D models of their financial position. A client can see, not just hear about, how adjusting their pricing strategy would affect margins over the next four quarters. They can rotate the model, zoom into a specific cost center, and watch the downstream effects ripple through the visualization in real time.
This builds trust in a way that flat reports cannot. When a client understands the data well enough to ask informed follow-up questions, the relationship shifts from “expert-delivers-a-verdict” to “advisor-and-client-explore-options-together.” Firms that pilot AR presentations consistently report stronger client retention, though quantifying that effect in isolation from other service quality factors is difficult.
Time Recovery and Error Reduction
The operational case for AR in routine accounting tasks is straightforward: reduce the time spent on manual cross-referencing and catch errors before they compound.
Scanning a paper invoice with an AR-equipped device extracts data and cross-checks it against records in a single step, a process that replaces manual entry and separate verification passes. Audit workflows using spatial mapping generate documentation automatically rather than requiring manual assembly. Based on vendor case studies, firms using AR in audit workflows report approximately 30% reduction in completion time and measurably fewer documentation gaps, though these figures should be read as directional rather than precise; independent validation is still catching up.
The compounding effect matters. Time saved on routine verification frees capacity for advisory work, the higher-margin, higher-value activity that most firms want to scale but struggle to staff adequately.
Navigating Challenges and Implementation Realities
Data Privacy, Security, and Regulatory Compliance
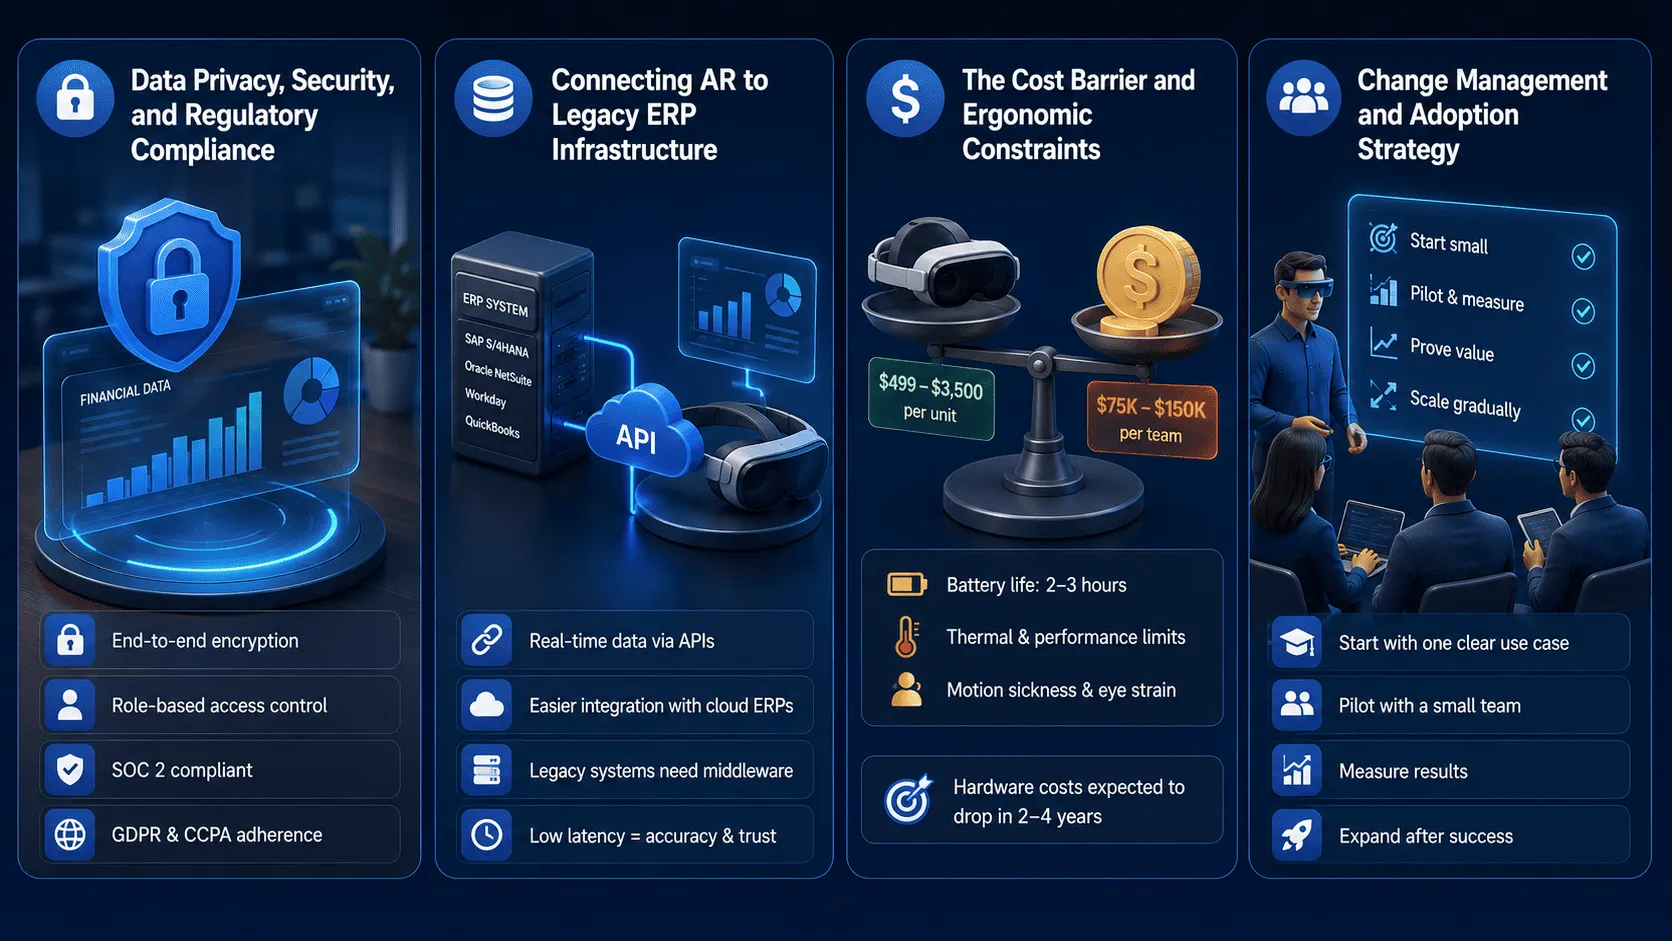
Financial data is among the most sensitive categories of information a firm handles, and AR introduces new attack surfaces. Any AR system that processes client financial data must meet the same security standards as the firm’s existing tools, end-to-end encryption, role-based access controls, SOC 2 compliance, and adherence to privacy frameworks, including GDPR and CCPA.
The specific risk with AR is that spatial computing devices often capture environmental data (including room geometry, ambient audio, and camera feeds from passthrough mode) alongside the financial data they’re designed to display. Firms need clear policies governing what environmental data the devices capture, where that data is stored, and how long it’s retained. Most current AR platforms for enterprise use provide configuration options for limiting environmental data collection, but the defaults aren’t always privacy-compliant out of the box.
Connecting AR to Legacy ERP Infrastructure
The practical bottleneck for most AR deployments is not the visualization layer; it’s the data pipeline. AR tools need near-real-time data feeds from the firm’s existing accounting and ERP systems (including SAP S/4HANA, Oracle NetSuite, Workday, and QuickBooks Advanced) to render accurate 3D models. If the data pipeline introduces even a few seconds of latency, the spatial visualization lags behind the source data, which undermines both accuracy and user trust.
Integration happens through APIs, and the quality of those API connections determines the practical usefulness of the AR layer. Firms with modern cloud-based ERPs typically have an easier integration path. Firms running on-premise legacy systems may face substantial middleware development costs to bridge the gap, a factor that’s often underestimated in initial AR deployment budgets.
The Cost Barrier and Ergonomic Constraints
The hardware economics remain the largest obstacle to widespread adoption.
Entry-level deployments using existing smartphones and tablets cost relatively little in additional hardware. But purpose-built AR headsets, the devices that deliver the full spatial computing experience, range from $499 (Meta Quest 3) to $3,500 (Apple Vision Pro and HoloLens 2) per unit. Equipping a 15-person audit team with mid-range headsets, custom software, and ERP integration can realistically cost $75,000 to $150,000 before ongoing licensing fees.
The physical limitations compound the cost concern. Current headset battery life sits at 2 to 3 hours of continuous use, workable for a focused audit session, but inadequate for full-day deployments. Thermal management on sustained workloads can cause devices to throttle performance. And a meaningful subset of users experience motion sickness or visual fatigue during extended sessions with spatially rendered data, particularly when viewing dense spreadsheet-equivalent visualizations in 3D. These ergonomic issues are improving with each hardware generation, but they remain a real constraint.
Smaller firms face a difficult ROI calculation. The productivity gains may not justify the upfront investment until hardware costs drop further, which industry analysts generally expect within the next 2 to 4 years as the spatial computing market scales.
Change Management and Adoption Strategy
Introducing AR into an accounting practice is as much an organizational challenge as a technical one. Staff who have built their expertise around spreadsheet-based workflows may view the shift skeptically, and that skepticism isn’t unreasonable; learning a fundamentally new interface takes time that comes at the expense of billable hours.
Firms that have navigated this transition successfully share a common approach: start with a single, well-defined use case (such as inventory audits at one client site), run the pilot with a small volunteer team, measure the results concretely, and expand only after the initial deployment proves its value in practice. Forcing firm-wide adoption before the pilot phase delivers evidence that tends to generate resistance rather than enthusiasm.
Training should be hands-on and task-specific rather than comprehensive. Most staff don’t need to understand the full AR platform; they need to know how to use it for the two or three tasks that affect their daily work. Workshops that focus on those specific workflows, with time for supervised practice, produce better adoption rates than broad-scope training programs.
What’s Next: The AR and VR Convergence in Accounting
AI-Driven Predictive Visualization
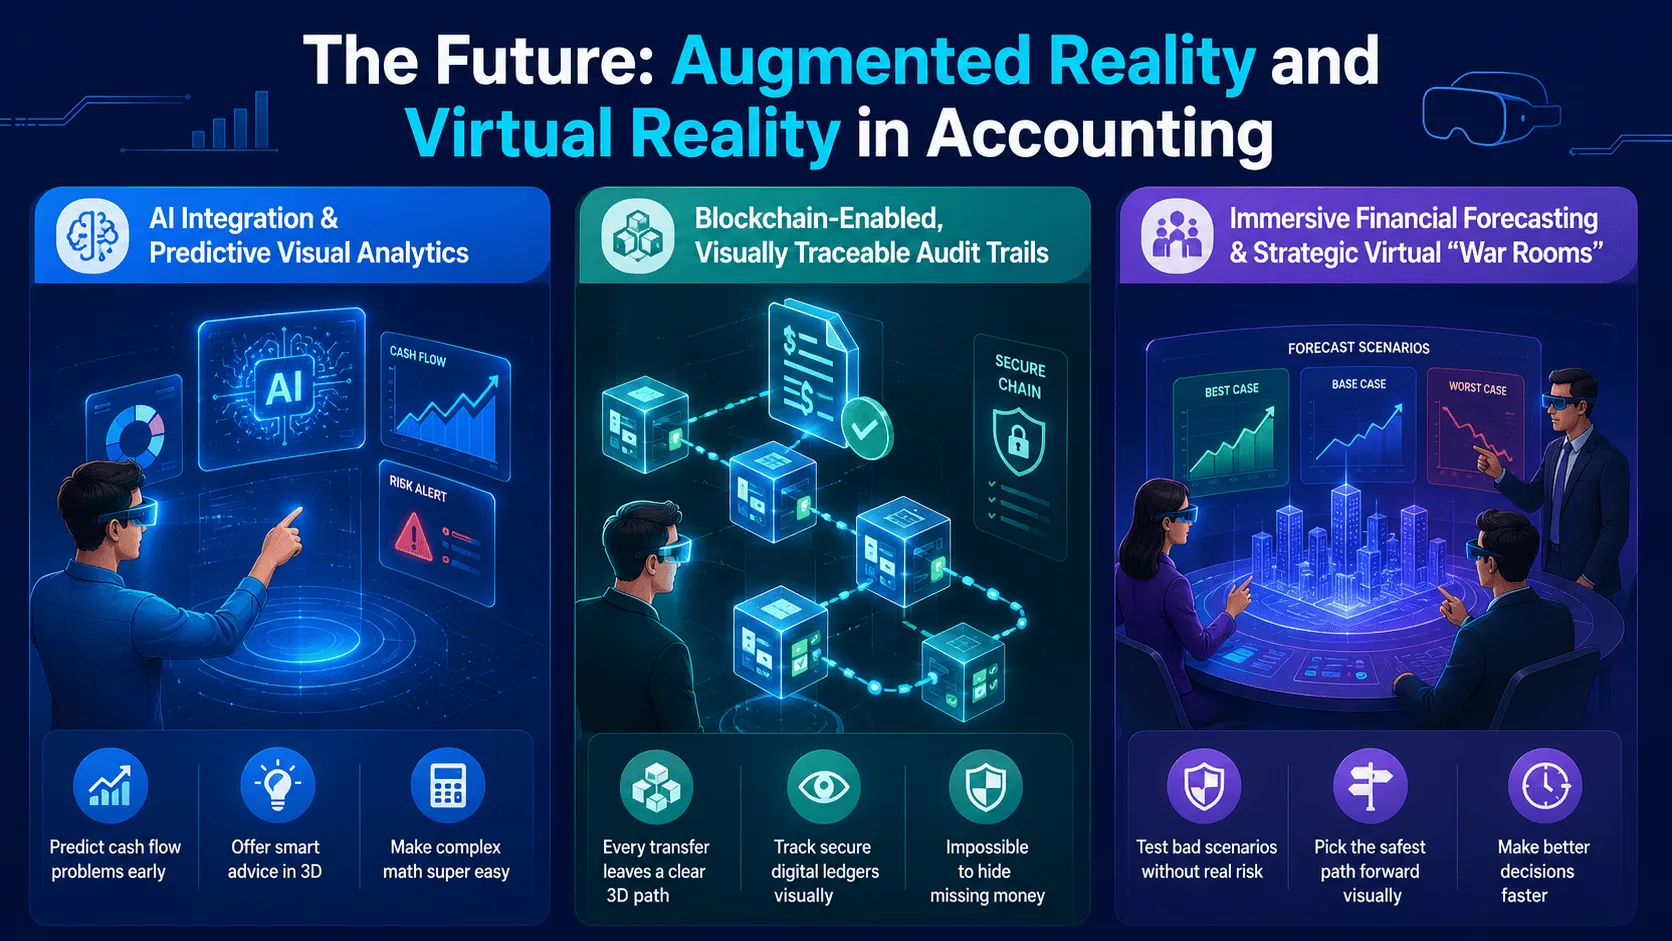
The next meaningful leap for AR in accounting is integration with machine learning models. Current AR systems render historical and real-time data spatially. Emerging platforms are beginning to layer predictive analytics on top of that spatial data, projecting cash flow forecasts, flagging accounts receivable at risk of delayed collection, and highlighting budget variances before they materialize.
The combination of AI pattern detection and spatial visualization is potentially powerful: the AI identifies the anomaly, and the AR interface makes it visible in context rather than burying it in an alert queue. However, most implementations remain in early pilot stages, and the accuracy of predictive models depends heavily on the quality and completeness of the underlying financial data.
Blockchain-Linked Immersive Audit Trails
Blockchain technology creates tamper-proof, chronologically ordered records of financial transactions. Combining these records with AR visualization produces what developers call immersive audit trails, spatial interfaces, where an auditor can visually trace a transaction’s entire lifecycle, from initiation through approval to settlement, rendered as a navigable 3D path.
The concept is compelling from an audit integrity standpoint. Every transaction leaves a verifiable, visually navigable trail. Auditors can follow the path with their eyes rather than querying databases and cross-referencing timestamps manually. The practical challenge is that the underlying infrastructure, cross-chain interoperability, real-time 3D rendering of ledger data, and standardized blockchain-to-AR data formats remain underdeveloped. This is a 3-to-5-year horizon technology, not a near-term deployment.
Virtual Financial “War Rooms” for Strategic Planning
The most forward-looking application of AR in accounting is the virtual war room, a shared spatial environment where leadership teams can model business scenarios in three dimensions, adjust variables in real time, and observe the downstream financial effects across the entire organizational model.
Instead of reviewing scenario analyses in sequential slides, decision-makers can stand inside the financial model, manipulate assumptions directly, and watch outcomes cascade through the visualization. This is particularly valuable for M&A modeling, restructuring analyses, and long-range capital allocation planning, where the number of interdependent variables exceeds what a standard spreadsheet presentation can convey intuitively.
The technology to support war rooms at enterprise scale exists in prototype form. Full production deployments are limited to a handful of large consultancies and financial institutions, and the cost of building custom war room environments remains prohibitive for most firms. Keep in mind that the value of this approach depends on the quality of the underlying financial models; a spatially rendered bad model is still a bad model.
Where This Leaves Accounting Firms
The shift from flat spreadsheets to spatial financial computing is real, but it’s gradual. AR delivers measurable value today in auditing and asset verification, meaningful improvement in client presentations and team collaboration, and promising but unproven potential in predictive analytics and strategic planning.
The practical path forward for most firms is incremental. Start by testing mobile AR for document scanning and invoice verification; this requires no new hardware and minimal training. If the results justify further investment, pilot a headset-based audit workflow at a single client engagement. Use the data from that pilot to build the business case for broader deployment.
Firms that wait for the technology to mature fully before exploring it risk falling behind competitors who are building internal expertise now. But firms that overcommit to expensive deployments before the use cases are proven risk a different kind of failure, the kind where the headsets end up in a closet. The middle path, as with most technology adoption in professional services, is disciplined experimentation: small bets, measured results, and expansion driven by evidence rather than enthusiasm.
FAQs
How is AR different from normal data charts?
Standard charts flatten financial data into two dimensions: bar graphs, line charts, and pivot tables. AR adds a spatial layer. You work with 3D financial models that you can walk around, pull apart by gesture, and view from multiple angles simultaneously. The practical difference is pattern recognition: anomalies that disappear in a row of numbers tend to stand out when rendered spatially.
What are the real business benefits?
The clearest gains are in auditing; early adopters report roughly 30% faster completion times, though independent benchmarks are still limited. Client presentations improve because stakeholders can interact with 3D models instead of sitting through static slide decks. Whether the ROI timeline is 12 months or 24 depends heavily on firm size, deployment scope, and how much of the existing workflow actually benefits from spatial visualization.
Can small firms afford this technology?
The entry cost is lower than most firms assume. Mobile AR runs on existing smartphones and tablets, no new hardware required. Web-based AR (using WebXR frameworks) works directly in the browser. Purpose-built headsets are where costs climb ($499 for a Meta Quest 3, $3,500 for enterprise-grade devices), but a small firm doesn’t need headsets to start getting value from AR-assisted document scanning or basic data visualization.
Is financial data safe with AR?
AR platforms designed for enterprise use support end-to-end encryption, role-based access controls, and SOC 2 compliance, the same standards your existing accounting software meets. The specific risk to watch is environmental data capture: spatial computing devices record room geometry and camera feeds alongside financial data. Make sure your AR vendor’s default privacy settings align with GDPR and CCPA requirements before deploying.
When will everyone use AR in accounting?
“Everyone” is a stretch, and timelines from vendors tend to be optimistic. Adoption is growing, Deloitte and EY have invested in internal AR capabilities, and mid-market firms are running pilots, but mass adoption depends on hardware costs dropping and battery life improving beyond the current 2-to-3-hour ceiling. Industry analysts project meaningful penetration (not universal adoption) among U.S. firms by 2028 to 2030, primarily for audits and client-facing work.