Table of Contents
What Is Predictive Analytics In Supply Chain Management?
Predictive analytics in supply chain management means using historical data, live signals, and machine learning to forecast what will probably happen next. The difference between it and standard reporting is timing: you get the warning before the problem arrives.
Traditional supply chains run on lagging indicators. A shipment is late, so you scramble. A supplier misses a deadline, so you expedite.
Predictive analytics reverses that sequence. Operations teams see the risk forming and act while they still have room to respond.
It does not replace human judgment. It gives planners better inputs faster. The goal is fewer surprises.
A logistics director, for example, sees a 72-hour delay probability for a shipment out of Southeast Asia, triggered by port congestion data and weather patterns. Instead of discovering the delay when the container fails to arrive, the team reroutes or adjusts production schedules three days early.
That is the basic promise. The rest of this guide covers how it works in practice, where it fails, and what separates real implementations from vendor slide decks.
Why Volatility Changed Everything
Global logistics shifted from a predictable environment into permanent volatility. COVID disruptions and geopolitical instability made traditional plan-driven supply chains dangerously brittle. Fuel price swings made the problem worse.
For a COO, unmanaged volatility is not an acceptable variance. It is a direct tax on the balance sheet.
The numbers show why. Ford Motor Company operates 37 global plants, uses 17 billion parts annually, and manages 10 tiers of suppliers. In that network, the “line-down” cost of a single part shortfall can reach millions of dollars per hour. If you rely on status updates that are already hours old, you find out about the rupture after it has already compromised production.
Last-mile delivery now accounts for up to 53% of total shipping costs. The margin for error is effectively gone.
Protecting EBITDA and margins now requires what some practitioners call “sentient” operations, meaning systems that ingest live data, update continuously, and generate actionable alerts. Getting there starts with understanding the analytical foundations.
Predictive Analytics Vs. Traditional Forecasting
This distinction matters most in budget conversations. Traditional forecasting and predictive analytics solve different problems.
| Dimension | Traditional forecasting | Predictive analytics |
| Data sources | Historical sales, seasonal patterns | Live IoT, weather, social signals, POS, supplier feeds |
| Update frequency | Monthly or quarterly | Continuous (hourly or event-driven) |
| Methodology | Statistical averages (moving averages, exponential smoothing) | Machine learning models (neural networks, gradient boosting, survival analysis) |
| Granularity | Category or regional level | SKU level, lane level, supplier level |
| Disruption handling | Breaks down during volatility | Adapts by ingesting new signal types |
| Output | A single forecast number | Probability ranges with confidence intervals |
| Actionability | “We expect X demand” | “There is a 78% chance of a 4-day delay. Here are three response options.” |
Traditional forecasting still works in stable environments with long planning horizons, particularly for annual budgeting and capacity planning.
When the world shifts abruptly, though, traditional models do not just lose accuracy. They lose relevance because they were never designed to ingest the signals that matter during disruption. Predictive analytics earns its return specifically in those moments.
The Analytics Spectrum: Descriptive, Predictive, And Prescriptive
Clear terminology helps when making the case to leadership. These are not interchangeable buzzwords. Each category answers a different question and produces a different kind of output.
| Analytics category | Question | Output | Example |
| Descriptive | What happened? | Historical reports, dashboards, KPI tracking | Reviewing last quarter’s freight spend |
| Predictive | What is likely to happen? | Forecasts, probabilities, risk signals, ETAs | Predicting a 4-day delay at the Port of Long Beach |
| Prescriptive | What should we do? | Recommended actions, optimized plans | Rerouting to alternative ports or switching suppliers |
Moving from descriptive to predictive allows teams to anticipate risks like automotive part shortfalls. The bigger leap happens with prescriptive analytics.
Instead of flagging a shipment as “at risk,” a prescriptive system evaluates constraints (lead time, cost, available capacity) and recommends a specific intervention, whether that is order splitting or carrier switching. It removes the “abundance of caution” that leads to bloated safety stock.
Why Predictive Analytics Is Maturing Now
This is not a future concept. It is maturing today because several technology drivers reached critical mass around the same time.
IoT Proliferation
Supply chains moved from “flying blind” to near total visibility. IoT sources now include sensors and RFID for tracking individual SKUs, satellites and radar for live vessel and truck locations, and temperature probes for cold chain monitoring, where environmental data prevents spoilage by triggering reroutes before temperature excursions ruin a shipment.
Computing Cost Collapse
Data storage costs per GB dropped from roughly $12.00 in 2000 to about $0.01 by 2016. Mid-market companies can now run the kind of heavy mathematical processing that used to require the infrastructure budget of a Fortune 50 firm.
Machine Learning Maturation
Neural networks can now parse trillions of events to identify anomalies, including predicting a ship captain’s routing behavior or detecting supplier instability before a single invoice is missed.
None of these alone would have been enough. Cheap compute, ubiquitous sensors, and mature algorithms had to arrive together for this to become viable.
What Data Do You Need?
Models are only as good as their inputs. The most common failure in predictive analytics projects is not bad algorithms. It is incomplete or poorly integrated data.
A robust system typically ingests the following:
| Data category | Sources | What it enables |
| Transactional | ERP systems, purchase orders, and invoices | Baseline demand patterns, supplier lead times |
| Warehouse | WMS (warehouse management systems) | Inventory position, pick/pack velocity, storage capacity |
| Transportation | TMS (transportation management systems), carrier APIs | Shipment status, transit times, and carrier performance |
| IoT / sensor | RFID, GPS trackers, temperature probes | Live location, condition monitoring, cold chain integrity |
| External signals | Weather APIs, port congestion feeds, geopolitical indices | Disruption probability, seasonal pattern shifts |
| Point of sale | POS systems, e-commerce platforms | Live demand signals, regional consumption patterns |
| Supplier | Supplier portals, EDI feeds | Production schedules, capacity constraints, quality metrics |
| Market / social | News feeds, social media sentiment | Early demand surge indicators, disruption signals |
The requirement that matters most is data integration, not data volume. A company with clean, connected data from five sources will outperform one with fragmented data from fifty.
Measurable Results: What The Numbers Actually Show
Operations leaders measure success by capital optimization and on-time in full (OTIF) performance. Better math directly means less physical inventory and lower working capital requirements.
Brooks Running And Inventory Resilience
Brooks Running implemented predictive ETAs and narrowed arrival variance from +/- 6 days to +/- 8 hours. That let them cut buffer stock by 5 days, which freed up significant working capital without hurting service levels.
Kroger And Food Waste
Since 2017, Kroger has used predictive analytics to cut food waste by 26% (roughly 245,289 tons). FreshDirect used similar systems to hold its waste rate below 2%.
Last Mile Efficiency
Route optimization in U.S. e-commerce has shown a 20% reduction in delivery time and 15% savings in fuel costs.
| Company | Use case | Result |
| Brooks Running | Predictive ETA/buffer stock | 5-day stock reduction, +/- 8 hour ETA accuracy |
| Kroger | Food waste prediction | 26% waste reduction (245K+ tons) |
| FreshDirect | Perishable demand forecasting | Sub 2% waste rate |
| Amazon | Anticipatory shipping | Inventory pre-positioned near predicted demand |
| Ford | Shortfall event prediction | 0.85 precision, 0.82 recall on disruption forecasts |
Applications Across The Supply Chain
Predictive analytics plugs into the daily workflows of supply chain directors. Here is where it shows up in practice.
Demand Sensing
Modern systems use “cross-item learning” and external signals (weather data, social media trends, local event calendars) to detect demand shifts before they reach the point of sale. Forecast adjustments happen in hours instead of waiting for the next quarterly planning cycle.
Inventory Optimization
Amazon uses “anticipatory shipping,” which means moving stock to warehouses nearest to predicted customers. The system does not wait for orders. It positions inventory based on probability, balancing service levels against capital.
Supplier Risk And Lead Time Prediction
Ford uses a “shortfall event” model grounded in Little’s Law and Kingman’s VUT Equation. In practical terms, the model analyzes how variability in supplier processes, combined with high utilization rates, creates exponentially longer wait times. It calculates “time to survive” (how long a plant can operate with current stock) and “time to recover” (how long replenishment actually takes) for every critical component.
Predictive Maintenance
IoT sensors on machinery predict failures before they happen, preventing unplanned downtime. The economics are simple: a planned maintenance window costs a fraction of an emergency shutdown.
Predictive Analytics In The Logistics Industry
Logistics is where predictive analytics delivers some of its most measurable returns, yet most implementations under-perform because they stop at basic ETA prediction.
Predictive ETA And Transit Visibility
Accurate arrival predictions require more than GPS tracking. Mature systems layer in port congestion data, customs clearance patterns, weather forecasts, and carrier-specific behavioral models. The question is not “where is my shipment?” It is “when will it actually arrive, given everything we know right now?”
Fleet Optimization
Predictive models analyze driver availability, vehicle maintenance schedules, traffic patterns, and delivery density to recommend fleet allocation. This goes beyond route planning. It matches the right vehicle, driver, and route to each delivery window.
Dock Scheduling And Yard Management
Warehouse receiving docks are a common bottleneck. Predictive systems forecast inbound arrival waves and recommend dock assignment sequences that minimize wait times. The difference between a well-scheduled dock and a first-come, first-served dock can be 2-3 hours of daily productivity per bay.
Warehouse Congestion Forecasting
By analyzing inbound shipment patterns, order volumes, and labor availability, predictive models forecast warehouse congestion 24-72 hours out. That gives operations managers time to adjust staffing, reroute inbound shipments, or redistribute orders across facilities.
Parcel Routing And Carrier Selection
For shippers moving high volumes, predictive analytics evaluates carrier performance by lane, season, and package characteristics to recommend the best carrier for each shipment. The cost difference between smart carrier selection and default routing runs 8-15% of total parcel spend.
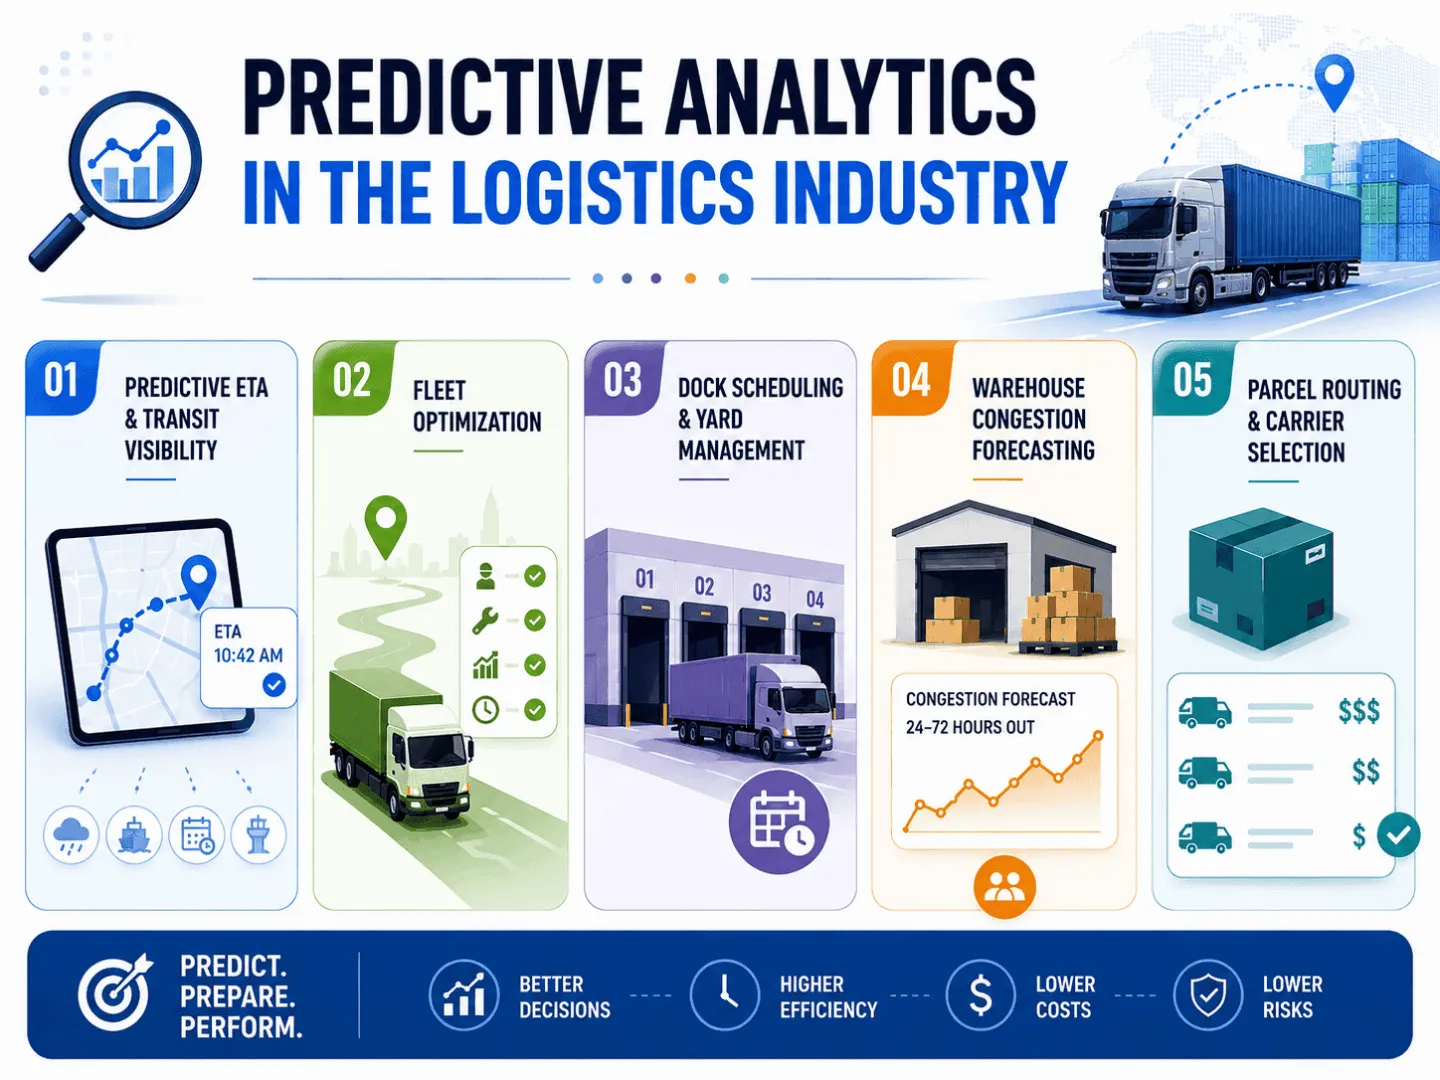
In logistics, the largest gains rarely come from a single application. They come from connecting predictions across ETA, dock scheduling, and carrier selection into one decision layer.
Why Accurate Predictions Still Fail: Decision Latency
This is the gap most vendors do not discuss. A model can produce a perfect prediction, and the organization can still fail to act on it.
The problem is decision latency: the time between when a prediction is generated and when someone executes a response.
Predictions typically stall in a few specific places:
- A model flags a supplier risk, but the procurement team needs three levels of approval before switching vendors. By the time someone signs off, the disruption has already hit.
- Predictions recommend preemptive reorders, but purchasing runs on weekly or biweekly cadences. The prediction sits in a queue and loses its value.
- The prediction fires in a dashboard that no one monitors in real time. The TMS where the logistics team actually works never receives the signal.
- Experienced planners override model recommendations based on instinct or outdated rules of thumb. Without explainability (the “why” behind the prediction), trust does not build.
- Decisions that span procurement, logistics, and production require coordination that most org structures cannot deliver at speed.
Fixing Decision Latency Is Structural, Not Technical
It requires pre-authorized playbooks (predefined responses for likely scenarios that skip the approval chain), predictions embedded directly in TMS, WMS, and ERP interfaces where people actually work, and escalation thresholds that bypass normal approvals when prediction confidence passes a defined level.
A prediction that lives outside the daily TMS/WMS interface is a prediction nobody uses. If the organization cannot act within the useful window, accuracy is irrelevant.
Data Science Methods And Explainability
Where Traditional Models Fall Short
Statistical models like ARIMA or SARIMA work for stable, seasonal patterns. They assume the future will resemble the past, and in modern supply chains, that assumption breaks regularly. When COVID shut down ports, when the Suez Canal was blocked, and when energy prices spiked, ARIMA-based forecasts did not just lose accuracy. They stopped being useful.
Ford’s Heterogeneous Seq2Surv Model
Standard AI models often fail because they assume all plants or suppliers behave the same way. Ford’s Heterogeneous Seq2Surv model specifically accounts for plant-specific behaviors using neural network embeddings.
The results:
| Model | Precision | Recall |
| Standard Seq2Surv | ~0.62 | ~0.30 |
| Heterogeneous Seq2Surv | 0.85 | 0.82 |
That is not an incremental improvement. The standard model catches roughly a third of disruptions. The heterogeneous version catches more than four out of five.
Explainability through SHAP
A model that nobody understands is a model that nobody uses. The SHAP (SHapley Additive exPlanations) framework addresses this.
With SHAP waterfall plots, a planner does not just see a “delay” signal. They see why. The system might show that a predicted 4-day delay is 60% driven by a 3.2-day signal in “quantity behind release” and 40% by a spike in “production usage.” That level of specificity enables targeted intervention, and it is what separates adopted models from abandoned ones.
Why Predictive Projects Fail
Most failures are not technical. They are organizational.
Fragmented data across legacy ERP and WMS systems is the most common blocker. Without aggregation of structured and unstructured data into a single layer, predictions stay flawed regardless of how good the model is.
Planner trust is another problem. If the workforce does not have explainability (SHAP or similar), they revert to manual adjustments. This is rational behavior. They have been burned before by opaque systems, and overriding the model feels safer than trusting it blindly.
Models trained on historical patterns fail when the world changes abruptly. Continuous retraining and monitoring are not optional.
A prediction that sits in a standalone dashboard while planners work in SAP will not get used. Insights have to live where the work happens.
And teams that try to predict everything at once, instead of proving value on a single use case first, tend to burn through their budget before they generate any return.
The most common failure pattern is not “the model was wrong.” It is “the model was right, but nobody acted on it.” That is an integration and process problem.
Can Predictive Analytics Fully Automate Supply Chain Decisions?
Not yet. And probably not for a while.
Predictive analytics can automate routine decisions where confidence is high: reorder triggers for stable SKUs, carrier selection for standard lanes, and dock scheduling based on inbound patterns. These are problems with clear constraints and measurable outcomes.
Strategic decisions still require human judgment. Supplier diversification, network redesign, crisis response: the variables are too numerous and the consequences too expensive for full automation.
The practical approach is to keep a human in the loop. The system handles most routine decisions on its own and escalates the rest (high-uncertainty, high-stakes) to human decision-makers with full context and recommended actions. Over time, the automation boundary expands as models improve and the organization builds trust.
This gets the efficiency gains of automation without the risk of an autonomous system making a bad call on something that matters.
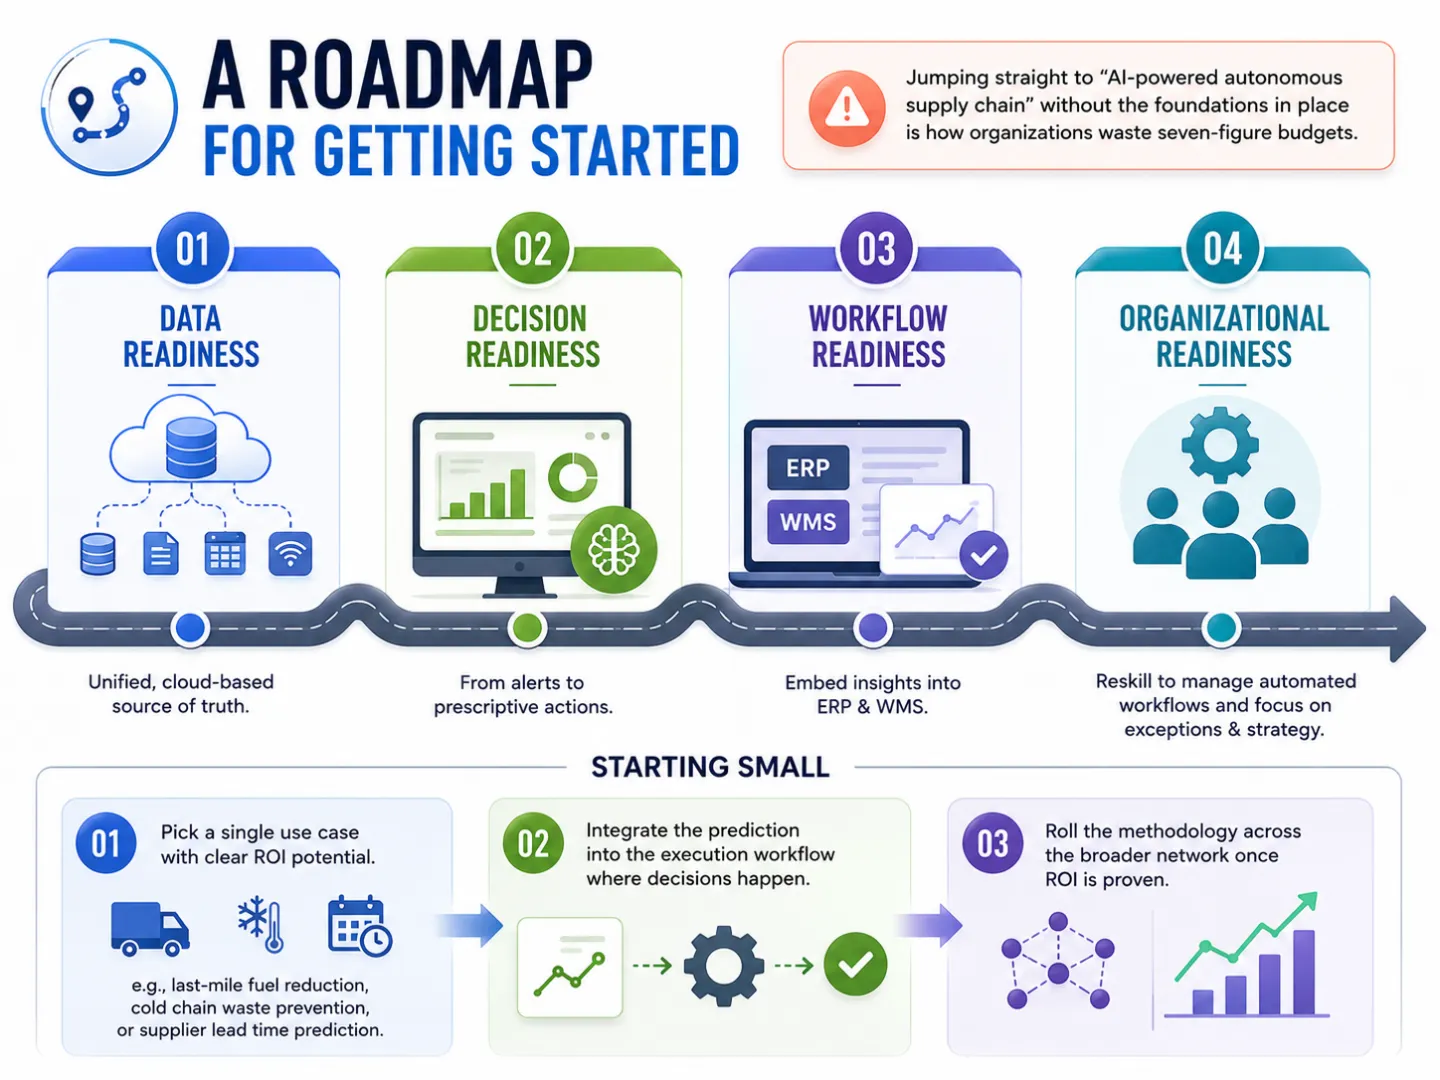
A Roadmap For Getting Started
Jumping straight to “AI-powered autonomous supply chain” without the foundations in place is how organizations waste seven-figure budgets.
- Phase 1: Data Readiness: Consolidate fragmented sources into a unified, cloud-based source of truth. Nobody writes case studies about this phase, but without clean, connected data, nothing downstream works.
- Phase 2: Decision Readiness: Define what you actually want each model to do. Move from alerts (“this might be late”) to prescriptive actions (“split this order across two carriers because delay probability is above 70%”).
- Phase 3: Workflow Readiness: Embed insights directly into ERP and WMS interfaces. If planners have to open a separate tool to see predictions, adoption stalls.
- Phase 4: Organizational Readiness: Reskill the workforce to manage automated workflows instead of manual spreadsheets. This is not about replacing people. It is about redirecting their expertise toward exceptions and strategic decisions that genuinely require human judgment.
Starting small:
- Pick a single use case with clear ROI potential: last-mile fuel reduction, cold chain waste prevention, or supplier lead time prediction.
- Integrate the prediction into the execution workflow where decisions actually happen.
- Roll the methodology across the broader network once the return is proven and the team has developed the muscle memory.
What Comes Next: Agentic AI And Digital Twins
The direction is toward autonomous execution. A few areas are worth watching.
Digital Twins: Creating digital replicas of the entire supply network to simulate “what-if” scenarios (a port strike, a supplier bankruptcy, a demand spike) before they happen. The value is testing response playbooks against realistic simulations instead of waiting for the actual event.
Agentic AI: Machine-to-machine integration where systems automatically execute reorders or reroutes based on prescriptive triggers. Early implementations focus on low-risk, high-frequency decisions (carrier selection, reorder point adjustments) where the cost of a wrong call is manageable.
Carbon-Aware Logistics: Using predictive modeling to optimize warehouse layouts and routing to reduce carbon footprint. This satisfies ESG targets and cuts fuel costs at the same time, and it is becoming more relevant as Scope 3 emissions reporting requirements expand.
FAQs
What is predictive analytics in supply chain?
It is the use of historical data, live IoT signals, and machine learning to forecast operational outcomes (shipment delays, demand surges, supplier disruptions) before they happen. The goal is shifting from reactive firefighting to acting before problems arrive.
How is it different from traditional demand forecasting?
Traditional forecasting relies on historical sales patterns and seasonal averages, usually updated monthly or quarterly. Predictive analytics ingests live signals (weather, port congestion, social sentiment) and updates continuously. The difference shows up most clearly during disruptions, when traditional forecasts break down, and predictive models keep adjusting.
What are the main applications?
Demand sensing, inventory optimization, supplier risk prediction, predictive maintenance, and logistics ETA forecasting are the most common. Kroger used it to cut food waste by 26%. Amazon uses it to ship inventory to warehouses before customers even order.
What data do you need to get started?
At minimum: transactional data from ERP systems, shipment data from TMS, and inventory data from WMS. More advanced implementations add IoT sensor data, weather, port congestion feeds, and point of sale data. Data integration matters more than data volume.
How much does it cost?
A focused pilot (single use case, existing data infrastructure) runs $150,000-$500,000. Enterprise-wide implementations with data integration, change management, and custom model development typically land between $2M and $10M+. Start with one use case that has a clear ROI and scale from there.
What kind of ROI do operations teams see?
It depends on the use case. Brooks Running cut 5 days of buffer stock. Kroger reduced food waste by 26%. Various e-commerce implementations have shown 20% faster deliveries and 15% lower fuel costs. Most organizations that scope their pilot correctly see positive returns within 12-18 months.
What does machine learning actually do here?
It is the pattern recognition layer. It identifies correlations across thousands of variables that a human analyst cannot process manually. Ford’s Heterogeneous Seq2Surv model, for instance, achieves 85% precision in predicting disruptions by modeling the specific behavior of individual plants and suppliers rather than treating them as interchangeable.
Can smaller companies use this, or is it only for enterprises?
The barrier to entry dropped significantly in recent years. Cloud platforms (AWS SageMaker, Google Vertex AI, and specialized supply chain tools) offer predictive capabilities without requiring an in-house data science team. Mid-market companies usually start with vendor-provided models for demand forecasting or ETA prediction and build capability over time.
How does it handle unprecedented events like COVID?
Traditional models fail because they depend on historical patterns. Predictive systems that ingest live external signals (port shutdowns, government policy changes, mobility data) can pick up disruption signals even without precedent. No model fully anticipates a truly novel event, but faster detection means faster response, and that is where the value comes from.
What is the role of IoT?
IoT provides the live data layer that makes predictions actionable. GPS trackers, RFID tags, temperature sensors, and environmental monitors generate continuous signals about shipment location, condition, and status. Without IoT, predictions rely on data that may be hours or days old, which is usually too stale for operational decisions.
What is cold chain monitoring?
Cold chain monitoring tracks temperature-sensitive products (pharmaceuticals, fresh food, biologics) throughout the supply chain. Predictive analytics improves it by forecasting temperature excursions before they happen, using weather data, refrigeration unit performance history, and transit time predictions. That allows reroutes or equipment adjustments before spoilage occurs.
How does explainability improve adoption?
Explainability tools like SHAP show planners why a prediction was made, not just what was predicted. Instead of a generic “delay risk: high” alert, the system shows that 60% of the risk comes from a specific supplier’s production backlog. That specificity builds trust and reduces the manual overrides that undermine model value.
What is decision latency?
It is the time gap between when a prediction is generated and when the organization acts on it. A perfectly accurate prediction has zero value if the approval process takes longer than the response window. Reducing decision latency through pre-authorized playbooks and embedded workflows often matters more than improving model accuracy.
How do digital twins help?
Digital twins are virtual replicas of the physical supply network. Operations teams use them to run “what-if” simulations (a port closure, a demand spike, a supplier switch) before committing to a decision in the real world. This lowers the cost and risk of testing strategic changes.
What is the difference between predictive and prescriptive analytics?
Predictive analytics tells you what will probably happen (a 78% probability of a 4-day shipment delay). Prescriptive analytics tells you what to do about it (split the order across two carriers, reroute through an alternative port). Prescriptive capabilities build on predictive foundations but add decision optimization.