Table of Contents
The Power BI versus Tableau debate remains one of the most hotly contested discussions among business intelligence solutions in the market. Both platforms continuously push boundaries with innovative features designed to transform how organizations extract value from their data assets, making them leading business intelligence platforms in today’s competitive landscape.
Power BI positions itself as an accessible, Microsoft-integrated solution perfect for streamlined analytics and simplified visualizations. Tableau targets advanced data professionals who need sophisticated tools for complex datasets and intricate analytical workflows. Organizations often rely on Power BI consulting services and expert guidance to maximize their investment in these business intelligence solutions.
Quick Comparison Overview:
| Aspect | Power BI | Tableau |
| Best For | Microsoft ecosystems, beginners, and cost-conscious organizations | Advanced analytics, data scientists, complex visualizations |
| Learning Curve | Gentle, familiar Microsoft interface | Steep but powerful customization options |
| Pricing | Budget-friendly with a free tier | Premium pricing, limited free version |
| Strengths | Microsoft integration, ease of use, and AI features | Superior visualizations, data handling, and flexibility |
| Target Users | Business professionals, SMBs, general audience | Data analysts, engineers, and visualization specialists |
Why do Power BI and Tableau lead the BI market in 2025?
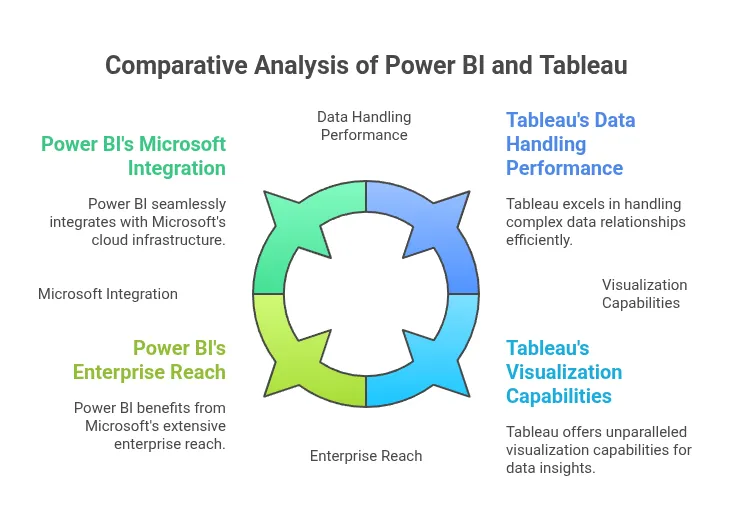
These platforms dominate because they’ve evolved beyond simple reporting tools into comprehensive analytical ecosystems. Power BI leverages Microsoft’s massive cloud infrastructure and seamless Office 365 integration, making it the natural choice for organizations already invested in Microsoft technologies. This integration makes it one of the best business intelligence software options for Microsoft-centric environments.
Tableau maintains its market position through unparalleled visualization capabilities and robust performance with massive datasets. The platform’s ability to handle complex data relationships while maintaining responsive performance sets it apart from other business intelligence platforms.
Both solutions benefit from strong vendor backing: Microsoft’s enterprise reach for Power BI and Salesforce’s CRM expertise for Tableau, ensuring continuous innovation and long-term viability. Organizations increasingly rely on specialized Power BI consulting services and expert business intelligence consultant guidance to navigate implementation complexities and maximize their BI investments.
The growing demand for expert guidance reflects these platforms’ sophistication and the critical importance of proper configuration for achieving optimal results with modern business intelligence solutions.
What are the key features of Power BI and Tableau?
Power BI’s Core Capabilities:
- Microsoft Ecosystem Integration: Seamless connectivity with Office 365, Azure, SharePoint, and Teams
- AI-Powered Analytics: Automated insights, anomaly detection, and natural language querying
- Self-Service Analytics: Drag-and-drop interface with guided data exploration
- Real-Time Data Access: Live dashboards with automatic refresh capabilities
- Mobile-First Design: Native iOS and Android apps with offline functionality
- Cost-Effective Licensing: Flexible pricing tiers accommodating various organizational needs
Tableau’s Distinguished Features:
- Advanced Visualization Engine: Unlimited customization with publication-quality graphics
- Complex Data Handling: Superior performance with large, intricate datasets
- Statistical Integration: Native R and Python support for advanced analytics
- Flexible Deployment: Cloud, on-premises, and hybrid hosting options
- Interactive Dashboards: Sophisticated drill-down and parameter-driven exploration
- Enterprise-Grade Security: Comprehensive data governance and access controls
Professional Power BI consulting Firm and expert business intelligence consultant support help organizations leverage these advanced features effectively, ensuring proper implementation and user adoption strategies that deliver measurable business value across various business intelligence platforms.
How do Power BI and Tableau compare in user interface and ease of use?
Power BI’s User Experience
Power BI deliberately mirrors Microsoft Office applications, creating an immediately familiar environment for Excel users. The ribbon-based interface reduces training time significantly, allowing business professionals to create basic reports within hours rather than weeks, making it one of the best business intelligence software choices for rapid deployment.
The platform emphasizes rapid dashboard creation through templates and automated suggestions. Users can quickly connect data sources, apply standard visualizations, and share insights without extensive technical knowledge, though Power BI consulting services can accelerate this process further.
Real-time streaming data integration enables live dashboards that reflect business changes instantly. API access facilitates custom connections, while pre-built templates accelerate implementation for popular services like Salesforce and Google Analytics. Expert Power BI consulting firms ensure optimal connector configuration.
Tableau’s Interface Approach:
Tableau’s interface prioritizes functionality over familiarity, providing granular control over every visualization element. While initially more complex, this approach enables data professionals to create sophisticated, publication-ready graphics impossible in simpler business intelligence solutions.
The drag-and-drop workspace accommodates advanced analytical workflows, supporting complex calculations, custom fields, and multi-layered visualizations that engage stakeholders at executive levels. A skilled business intelligence consultant can help organizations navigate Tableau’s learning curve effectively.
Organizations implementing either platform benefit significantly from structured training programs and best practice establishment, often requiring specialized consulting expertise to ensure smooth user transitions and maximize productivity with their chosen business intelligence platforms.
What data integration and connectivity options do these platforms offer?
Power BI’s Integration Strengths
Power BI excels in Microsoft-centric environments with native connectors for Azure databases, SQL Server, SharePoint lists, and Office applications. The platform supports over 100 data sources through standardized connectors and Power Query’s advanced transformation capabilities, establishing it as the premier best business intelligence software for Microsoft ecosystems.
Real-time streaming data integration enables live dashboards that reflect business changes instantly. API access facilitates custom connections, while pre-built templates accelerate implementation for popular services like Salesforce and Google Analytics. Expert Power BI consulting services ensure optimal connector configuration.
Tableau’s Connectivity Advantages
Tableau demonstrates exceptional flexibility in connecting diverse data sources, from traditional relational databases to modern big data platforms like Hadoop and Spark. Live connection capabilities eliminate data movement requirements while maintaining real-time access to source systems, making it a standout among business intelligence solutions.
The platform’s ability to blend data from multiple sources within a single visualization enables comprehensive analytical perspectives impossible with simpler tools. Advanced data preparation features support complex transformation scenarios without requiring separate ETL processes.
Expert implementation services and business intelligence consultant guidance ensure optimal data architecture design, addressing security requirements and performance considerations that impact long-term success across different business intelligence platforms.
How do visualization and dashboard capabilities compare between the two?
Power BI’s Visualization Approach
Power BI provides comprehensive standard business charts with growing support for custom visuals through its marketplace. Recent improvements include enhanced formatting options, interactive features, and mobile-optimized layouts that maintain functionality across devices, reinforcing its position among the best business intelligence software options.
The platform emphasizes quick dashboard creation with automated chart recommendations based on data types. Built-in analytics features like trend lines, forecasting, and clustering help business users discover insights without advanced statistical knowledge.
Tableau’s Visualization Excellence
Tableau’s visualization engine remains industry-leading among business intelligence solutions, offering unlimited customization possibilities for creating complex, interactive dashboards. Advanced features like calculated fields, parameters, dual-axis charts, and custom color palettes enable sophisticated analytical storytelling.
The platform excels in handling geographical data, time-series analysis, and statistical visualizations that require precision and flexibility. Animation capabilities and interactive filters create engaging user experiences that encourage data exploration across various business intelligence platforms.
Professional guidance from experienced business intelligence consultant experts helps organizations establish visualization standards and governance frameworks that ensure consistency while maximizing the impact of either platform’s capabilities, often complemented by specialized Power BI consulting services.
What advanced analytics and AI features do these platforms provide?
Power BI’s AI Integration
Power BI leverages Azure’s machine learning services to provide automated insights, anomaly detection, and predictive analytics capabilities directly within dashboards. The Q&A feature allows users to ask questions in natural language and receive instant visualized responses, making it exceptional best business intelligence software for AI-driven insights.
Integration with Cognitive Services enables text analytics, sentiment analysis, and computer vision capabilities that extend traditional BI into modern AI-driven insights. Automated machine learning features help business users build predictive models without data science expertise.
Tableau’s Advanced Analytics
Tableau incorporates sophisticated statistical functions and supports R/Python integration for custom analytics workflows. The platform’s partnership with Salesforce brings Einstein Analytics capabilities, enhancing predictive modeling and automated pattern recognition within modern business intelligence solutions.
Advanced clustering, forecasting, and statistical modeling features enable data scientists to perform complex analyses directly within the visualization environment. Custom calculations and table calculations support intricate analytical scenarios requiring mathematical precision.
Specialized Power BI consulting services and expert business intelligence consultant support help organizations implement these AI capabilities effectively, establishing governance frameworks that ensure reliable, actionable insights aligned with business objectives across different business intelligence platforms.
Which business intelligence solution dominates in 2025?
Neither platform universally dominates—each excels in specific scenarios based on organizational requirements and priorities. Power BI shows stronger adoption in mid-market segments and Microsoft-integrated environments, driven by cost-effectiveness and ease of implementation, making it popular best business intelligence software for many organizations.
Tableau maintains leadership in advanced analytics scenarios where visualization sophistication directly impacts business outcomes. Enterprise organizations with dedicated data teams often prefer Tableau’s flexibility and customization capabilities among available business intelligence solutions.
Decision Factors:
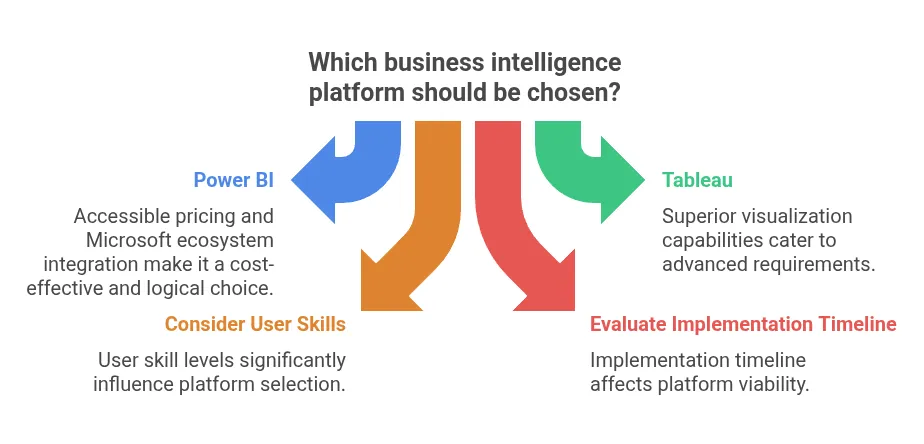
- Budget constraints favor Power BI’s accessible pricing structure
- Microsoft ecosystem investment makes Power BI the logical choice
- Advanced visualization requirements point toward Tableau’s superior capabilities
- User skill levels influence platform selection significantly
- Implementation timeline affects platform viability
Success with either platform requires strategic planning, proper training, and often professional Power BI consulting services or expert business intelligence consultant guidance that ensure implementations align with business objectives and deliver measurable value to stakeholders across various business intelligence platforms.
Key Takeaways
Power BI Advantages:
- Cost-effective licensing ideal for budget-conscious organizations
- Seamless Microsoft integration reduces implementation complexity
- User-friendly interface accelerates adoption across business teams
- Strong AI capabilities democratize advanced analytics
- Rapid deployment within existing Microsoft infrastructure
Tableau Strengths:
- Industry-leading visualization capabilities enable sophisticated storytelling
- Superior performance with complex, large-scale datasets
- Flexible deployment options accommodate diverse technical requirements
- Advanced analytics integration supports data science workflows
- Robust community and extensive learning resources
Universal Success Factors:
- Professional Power BI consulting services and business intelligence consultant expertise significantly improve implementation outcomes
- Proper training programs ensure effective user adoption
- Strategic platform selection based on organizational needs and constraints
- Ongoing governance frameworks maintain data quality and security standards
Frequently Asked Questions
Which is better for the future: Power BI or Tableau?
Both business intelligence solutions demonstrate strong future potential through continuous innovation and vendor investment. Power BI benefits from Microsoft’s cloud-first strategy and AI integration, while Tableau leverages Salesforce’s CRM expertise and advanced analytics capabilities. The “better” choice depends entirely on organizational requirements, technical infrastructure, and analytical sophistication needs.
What is the difference between BI and business intelligence?
BI and business intelligence refer to identical concepts—technologies, processes, and methodologies that transform raw data into actionable insights for informed decision-making. These terms are interchangeable in professional contexts when discussing business intelligence platforms.
What is more advanced than Power BI?
Several specialized platforms offer more advanced capabilities for specific use cases: SAS for statistical analysis, IBM Cognos for enterprise reporting, Qlik for associative data modeling, and custom-built solutions for unique industry requirements. However, “advanced” depends on specific analytical needs rather than universal superiority among best business intelligence software options.
What are the benefits of Tableau vs Power BI?
Tableau excels through superior visualization flexibility, better handling of complex data relationships, stronger performance with massive datasets, more comprehensive statistical functions, and greater customization options. These advantages make it ideal for organizations prioritizing analytical sophistication over cost considerations when evaluating business intelligence solutions.
What are the disadvantages of Tableau over Power BI?
Tableau’s primary drawbacks include significantly higher licensing costs, steeper learning curves requiring extensive training, more complex administrative requirements, limited Microsoft ecosystem integration, and resource-intensive infrastructure needs that increase total cost of ownership compared to Power BI’s streamlined approach. Organizations often engage business intelligence consultant services to navigate these challenges effectively.