Table of Contents
What Are Business Intelligence Tools?
Business Intelligence (BI) tools help companies collect, organize, and analyze large amounts of data.
They are the core software that turns raw data into actionable information, empowering businesses to make better, faster decisions.
Modern BI platforms go well beyond static reports.
They offer real-time visibility, interactive visualizations, instant alerts, and predictive insights, acting as a strategic advisor rather than a simple reporting tool.
These versatile data intelligence tools are at the forefront of modern data analysis.
What Is Business Intelligence?
Business Intelligence (BI) is the use of strategies and technology to analyze current and historical data.
The goal is to help businesses make smarter choices, stay ahead of competition, and turn complex data into clear, actionable insights.
A Brief History of BI Tools
The idea of business intelligence began in 1864.
A historian named Richard Miller Devens wrote about a banker from the 1600s who used facts, not guesses, to succeed.
Later, in the early 1900s, Frederick Taylor improved factory work by timing tasks to make them faster and more efficient.
In the 1950s, Hans Peter Luhn, known as the “Father of Business Intelligence,” imagined BI systems that could work like today’s machine learning.
The 1970s brought relational databases thanks to Edgar Codd.
These systems stored large amounts of information, making it easier to build advanced business intelligence software.
Since then, business intelligence solutions have continued to grow, helping businesses of all kinds, from politics to advertising, make smarter choices.
These comprehensive business intelligence solutions now offer unparalleled insights across various sectors.
How Do Business Intelligence Tools Work?
Business Intelligence tools pull raw information from many places and store it in a central location called a data warehouse.
From there, users can:
- Ask questions about the data
- Connect to data sources: databases, cloud warehouses (Snowflake, BigQuery, Redshift), flat files, and SaaS APIs
- Model and transform data into business-meaningful concepts (e.g., ‘revenue,’ ‘active users’)
- Create reports and charts using integrated business intelligence reporting tools
- Build dashboards, with each type of dashboard serving a specific business purpose
- Predict future trends using machine learning
- Distribute insights via mobile apps, embedded analytics, or automated alerts
Mobile BI tools even let users check their dashboards from anywhere in the world.
A content distribution tool can also be integrated to help efficiently share data insights across teams, stakeholders, or departments. These capabilities underscore the versatility of modern data intelligence tools. For automated file-based pipelines, teams sometimes integrate SFTP with HubSpot to load exports on a schedule.
Why BI Tools Matter in 2026: Key Statistics
| Market Reality Check: Power BI leads with ~20% market share | Tableau follows at 16.4% | Over 491,000 companies use BI tools globally | 91% of BI users report significantly improved decisions | Companies using the right BI tool see up to 5x faster decision-making and 27% higher profitability | 73% of BI implementations fail to deliver ROI in year one most often due to tool-org misalignment. |
The BI market is maturing rapidly.
Leaders in 2026 expect tools to move beyond descriptive analytics (what happened) and predictive analytics (what will happen) toward prescriptive analytics, telling you what to do next.
AI-driven natural language queries, embedded analytics within existing applications, and real-time data pipelines are now baseline expectations, not premium features.
14 Best Business Intelligence Tools Overview
1. Microsoft Power BI: Best Overall Market Leader
Microsoft Power BI is a leading business intelligence and analytics tool that helps people see and understand their data.
It fits perfectly with other Microsoft products like Excel and Azure.
Key Features
- Copilot AI: Natural language queries, automated insight generation, and anomaly detection powered by Microsoft AI.
- Power Query: Low-code data cleaning, transformation, and shaping, reducing dependence on external ETL tools.
- Microsoft Ecosystem: Deep native integration with Excel, Azure, SharePoint, Teams, and SQL Server.
- Real-Time Refresh: Configure real-time dashboards or scheduled refreshes based on business needs.
Use Cases
Best for organizations already invested in Microsoft infrastructure. Ideal for finance, operations, and cross-department reporting at scale.
Notable Users
Used globally by 114,000+ companies. Pricing starts at $10/user/month (Pro).
2. Tableau: Premier Data Visualization Leader
Tableau is a popular business intelligence software that helps people see and understand their data better.
It lets users connect to many types of data, create colorful dashboards, and easily share their findings.
Key Features
- Einstein AI: Salesforce-powered AI for smart recommendations and predictive analytics.
- Drag-and-Drop Interface: Intuitive visual builder requiring no coding, ideal for business analysts.
- Broad Connectivity: Connects to 80+ data sources, including spreadsheets, cloud services, and databases.
- Tableau Public: Free community platform for learning, sharing, and showcasing dashboards.
Use Cases
Best for teams prioritizing visualization quality, data storytelling, and exploratory analytics. Strong fit for marketing, sales, and customer analytics.
Notable Users
Used by RetailMax, large enterprises worldwide. Pricing starts at $15/user/month.
3. Amazon QuickSight: Cloud-Powered Analytics for AWS Users
QuickSight is a business intelligence tool made by Amazon Web Services (AWS).
It helps users easily and quickly explore data online.
Key Features
- Pay-per-Session Pricing: You pay only when someone actually uses the tool, ideal for cost management at scale.
- AWS Integration: Native connectivity to Redshift, S3, RDS, Athena, and all major AWS data services.
- ML Insights: Automatically detects anomalies, forecasts trends, and highlights key drivers in your data.
- Q Natural Language: Ask questions in plain English and get instant visual answers.
Use Cases
Perfect for AWS-centric organizations. Scales automatically with usage, no infrastructure management required.
Notable Users
Siemens Gamesa, GE Healthcare, and Deloitte. Pricing from $18/author/month.
4. Google Looker: Modern Data Platform for Enterprises
Looker, now owned by Google Cloud, is a new type of data intelligence tool that helps teams explore, share, and understand data better.
This business intelligence platform is designed for modern data exploration.
Key Features
- LookML: A semantic modeling language that lets teams define data relationships and metrics once, reused everywhere.
- Google Workspace Integration: Connects directly to Slides, Sheets, and BigQuery for seamless collaboration.
- Embedded Analytics: Embed Looker dashboards and reports into your own applications and workflows.
- Vertex AI Integration: Leverage Google’s AI/ML capabilities directly within your data exploration.
Use Cases
Great for large enterprises wanting governed self-service analytics with strong data modeling discipline.
Notable Users
Spotify, BuzzFeed, HubSpot. Pricing varies; part of Google Cloud Platform.
5. Qlik Sense: Associative Analytics for Discovery
Qlik View and Qlik Sense help people discover hidden patterns in their data.
It’s fun and easy to explore, acting as an effective data intelligence tool for discovery.
Key Features
- Associative Engine: Reveals hidden relationships across data, going anywhere in your data without predefined query paths.
- Self-Service: Business users explore data independently without requiring IT support.
- 300+ Connectors: Integrates with an exceptionally wide range of data sources.
- Cognitive Engine: AI-powered insights surface hidden patterns and suggest relevant associations.nse: Associative Analytics for Discovery
Use Cases
Excellent for organizations that value exploratory data discovery and want to uncover unexpected insights.
Notable Users
Qualcomm, Canon, Chobani. Market share ~10%.
6. ThoughtSpot: Search & AI-Driven Self-Service Analytics
ThoughtSpot makes it super easy for anyone to find answers in their data.
It works a lot like Google search, making it a highly accessible data intelligence tool.
Key Features
- Google-like Search Interface: Any user can type a question in plain English and get instant visual answers, no SQL needed.
- SpotIQ AI Engine: Proactively finds trends, patterns, and anomalies you might have missed.
- SearchIQ: Understands natural language context to deliver accurate, relevant results.
- Live Analytics: Real-time, interactive dashboards that update instantly as data changes.
Use Cases
Ideal for democratizing analytics across non-technical teams. Strong in retail, healthcare, and financial services.
Notable Users
Walmart, Hulu, Snowflake, Disney, Comcast.
7. Domo: Cloud-Native BI for Real-Time Collaboration
Domo business intelligence tools are a platform made fully in the cloud.
It focuses on real-time teamwork and data sharing.
It has become widely known as a leading business intelligence software for healthcare in 2026.
Key Features
- 1000+ Connectors: Domo connects to more data sources than almost any other BI platform on the market.
- Domo.AI: Full AI suite including generative AI features, predictive analytics, and intelligent alerting.
- Cloud-Only Architecture: Fully managed, no infrastructure to maintain, accessible from anywhere.
- Real-Time Alerts: Get notified instantly when key metrics change, so teams respond faster.
Use Cases
Best for organizations needing real-time data sharing across distributed teams. Popular in retail, media, and healthcare.
Notable Users
Mastercard, National Geographic, The Honest Company.
8. Zoho Analytics: Affordable Self-Service BI for SMBs
Zoho Analytics provides a cost-effective, self-service business intelligence and analytics platform with robust business intelligence reporting tools, designed to be accessible for businesses of all sizes.
Key Features
- Zia AI Assistant: Ask questions in plain English and get instant reports, powered by Zoho’s AI engine.
- Zoho Suite Integration: Natively connects with CRM, Projects, Books, and the entire Zoho ecosystem.
- Collaborative Analytics: Share dashboards, leave comments, and co-author reports with your team.
- White-Labeling: Brand your analytics portal for client or partner use.
Use Cases
Perfect for small and mid-sized businesses wanting powerful but affordable, easy-to-deploy BI.
Notable Users
KPMG, Suzuki, HP, TaskUs. Pricing from $30/month for 2 users.
9. IBM Cognos Analytics: Enterprise-Grade BI with Watson AI
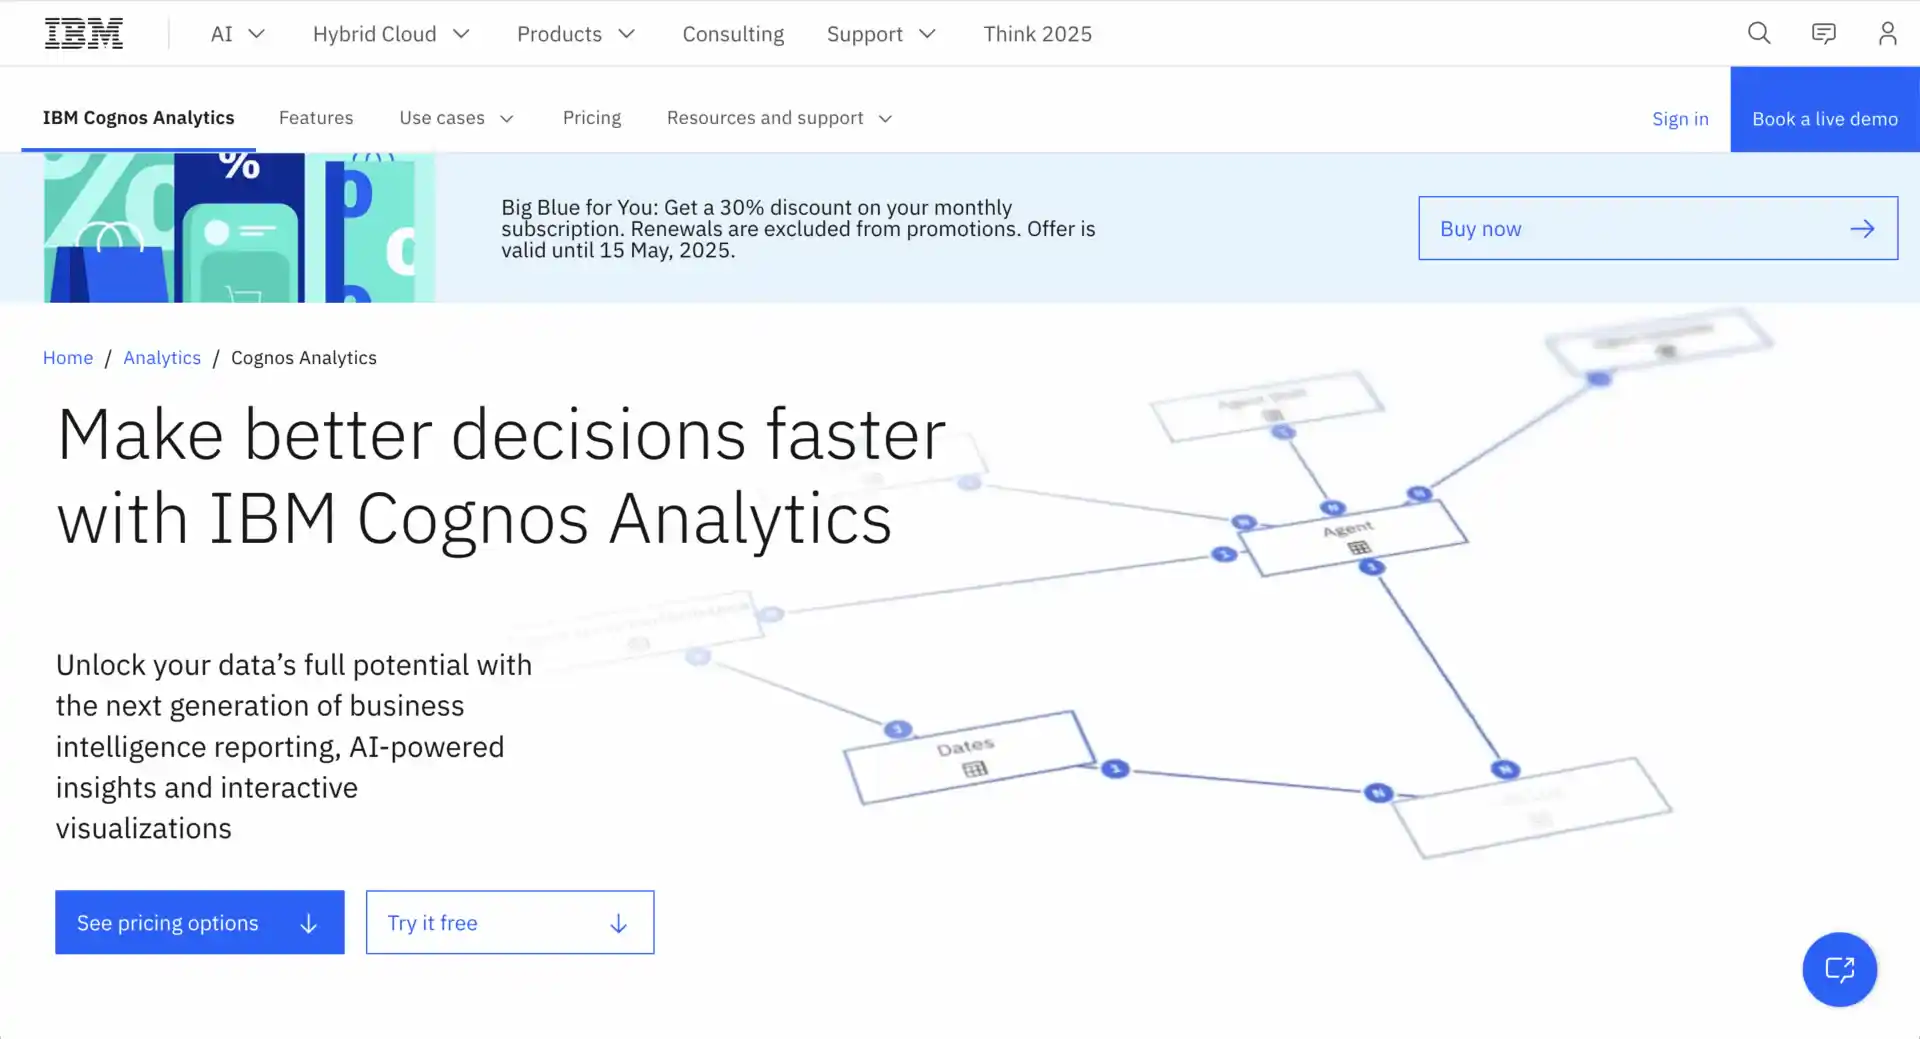
IBM Cognos Business Intelligence software is a powerful business intelligence tool from IBM that helps businesses connect, understand, and show their data in easy ways.
It helps companies make smart decisions using their data.
Key Features
- Watson AI: IBM’s enterprise AI provides natural language Q&A, auto-generated narratives, and smart data discovery.
- Scalable Architecture: Handles very large datasets with fast performance, designed for enterprise scale.
- Governed Reporting: Enterprise-grade data governance with strong role-based security and audit trails.
- Multi-Source Connectivity: Connects to databases, cloud platforms, Hadoop, and mainframe data.
Use Cases
Ideal for large organizations in finance, healthcare, and manufacturing requiring robust governance and IBM ecosystem integration.
Notable Users
Global enterprises across banking, insurance, and government sectors.
10. MicroStrategy: Enterprise Intelligence with Zero-Click Insights
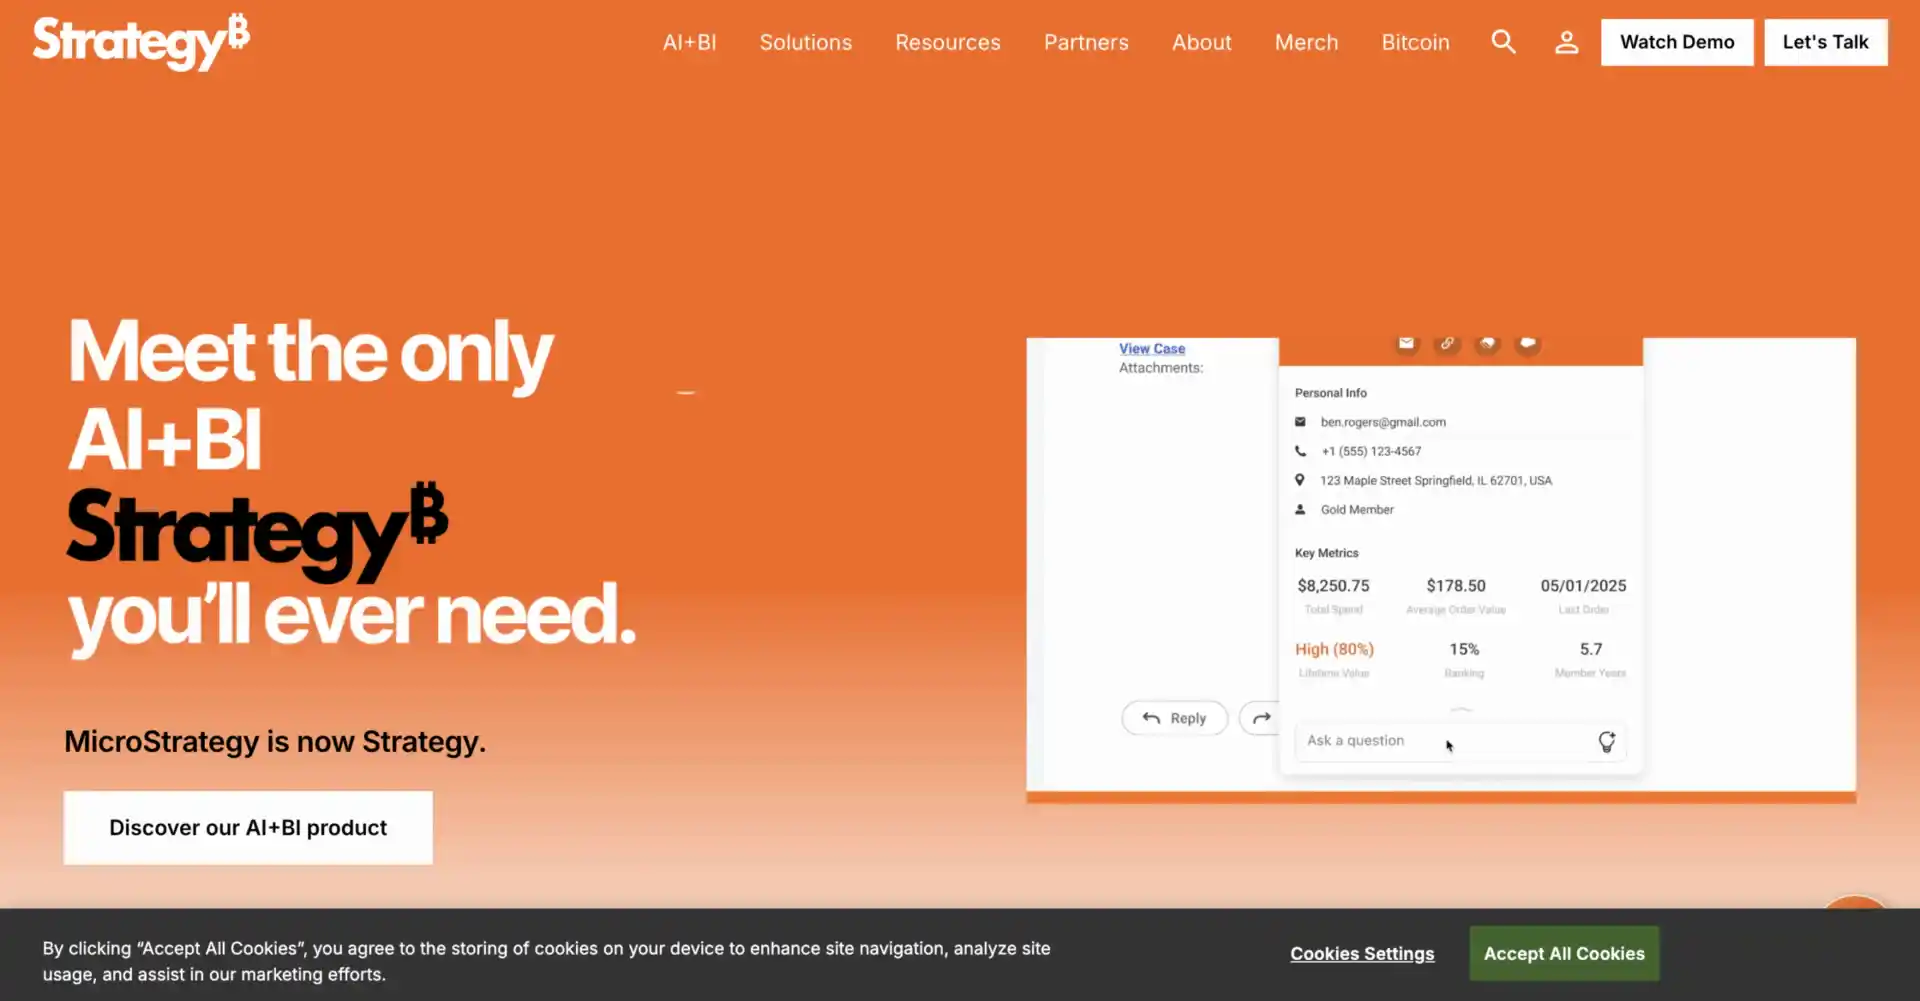
MicroStrategy offers an enterprise-grade business intelligence platform combining traditional BI capabilities with modern features like HyperIntelligence®, mobile analytics, and federated analytics.
Key Features
- HyperIntelligence: Zero-click insights appear as cards when users hover over text in everyday apps like Outlook or Chrome.
- Enterprise Security: Multi-factor authentication, object-level security, and advanced encryption built in.
- Federated Analytics: Query and analyze data across hybrid cloud, on-premise, and multi-cloud environments.
- Dossier Authoring: Interactive workbooks combining visualizations, data, and multimedia
Use Cases
Best for large enterprises needing comprehensive security, federated data access, and wide data distribution across the organization.
Notable Users
Enterprises in financial services, retail, and government worldwide.
11. SAP BusinessObjects: Comprehensive BI for SAP-Centric Organizations
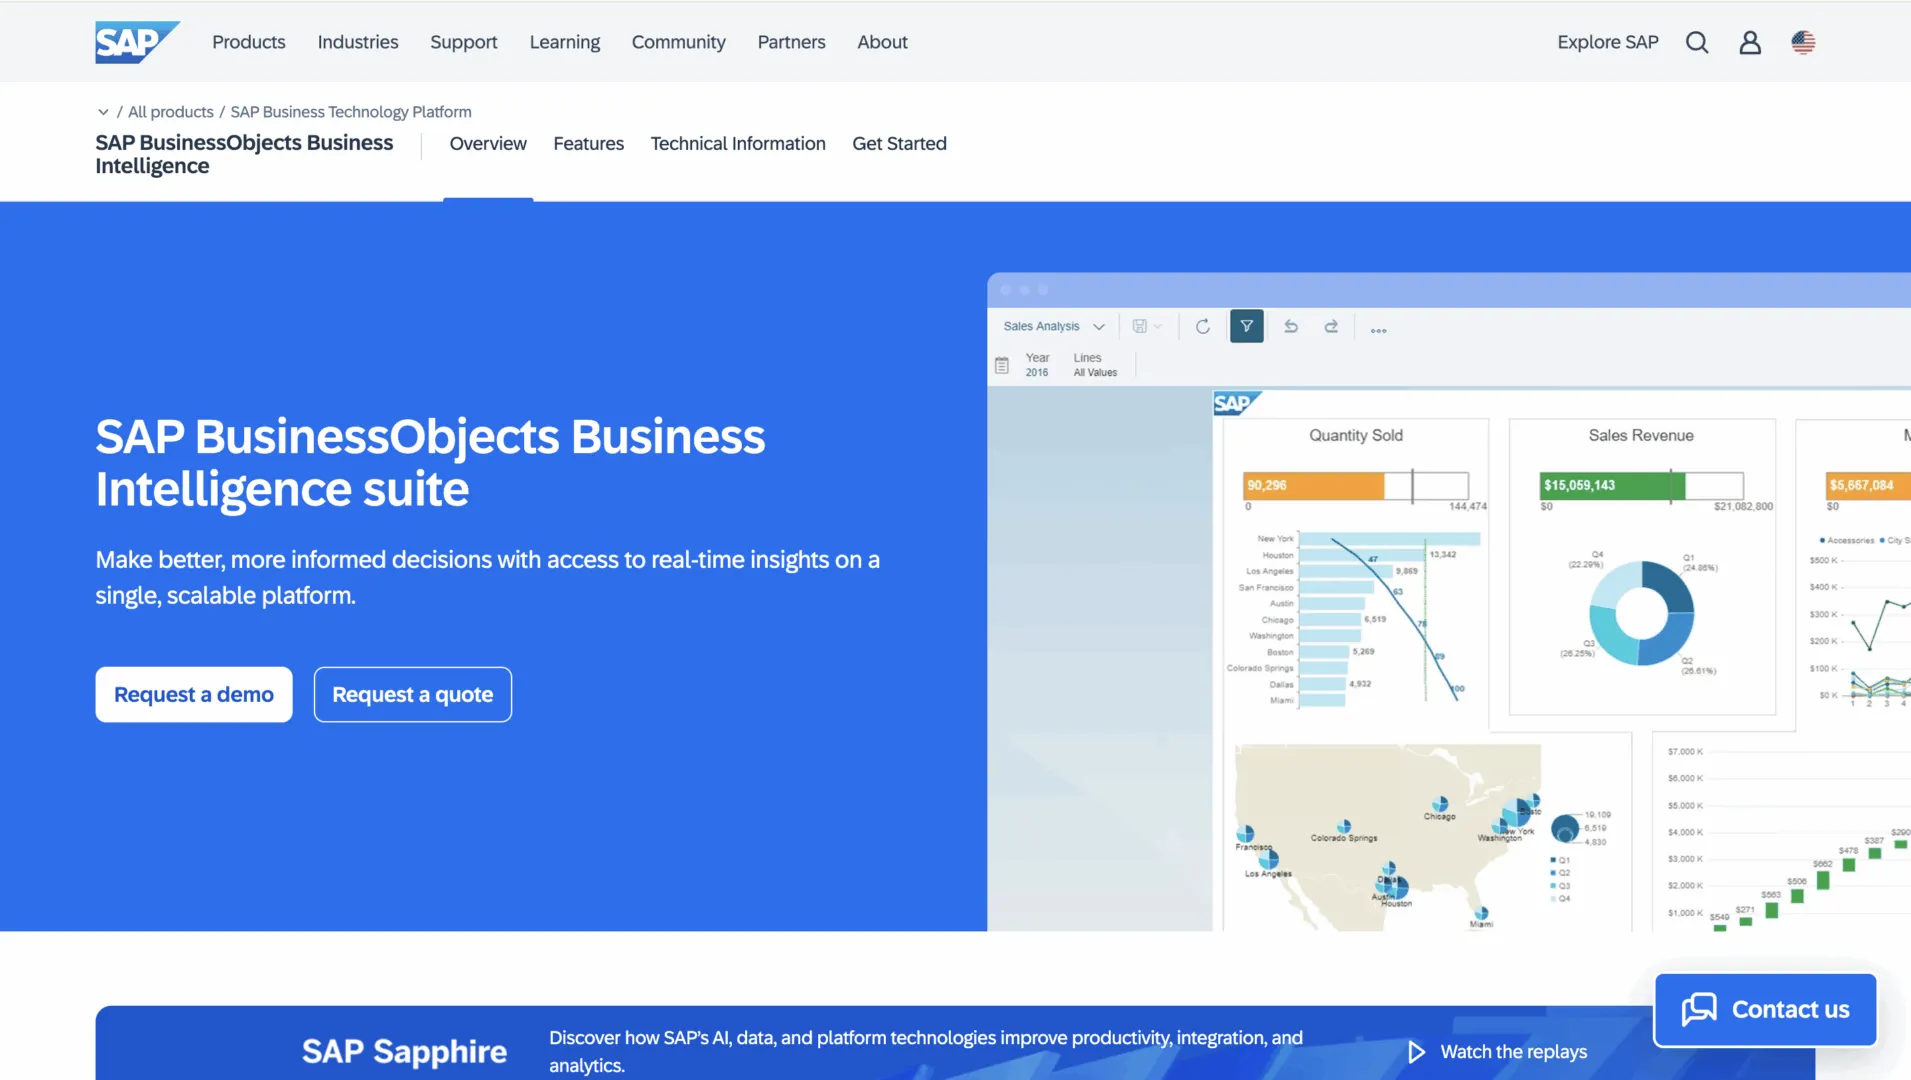
SAP BusinessObjects is a robust business intelligence platform. It offers various business intelligence reporting tools for reporting, analysis, and data visualization. It works well with SAP’s ERP and business applications.
Key Features
- SAP S/4HANA Integration: Seamless native connectivity with SAP ERP, BW, and HANA for real-time operational analytics.
- Semantic Layer: Abstracts technical complexity so business users can explore data without database knowledge.
- Web Intelligence: Flexible ad-hoc reporting and analysis with intuitive report design.
- Predictive Analytics: Built-in machine learning models for trend analysis and forecasting.
Use Cases
Best for SAP-centric organizations needing embedded analytics, compliance reporting, and enterprise-wide data governance.
Notable Users
Unilever, BMW, Nestlé, Coca-Cola, BP.
12. Yellowfin BI: Analytics with Collaborative Storytelling
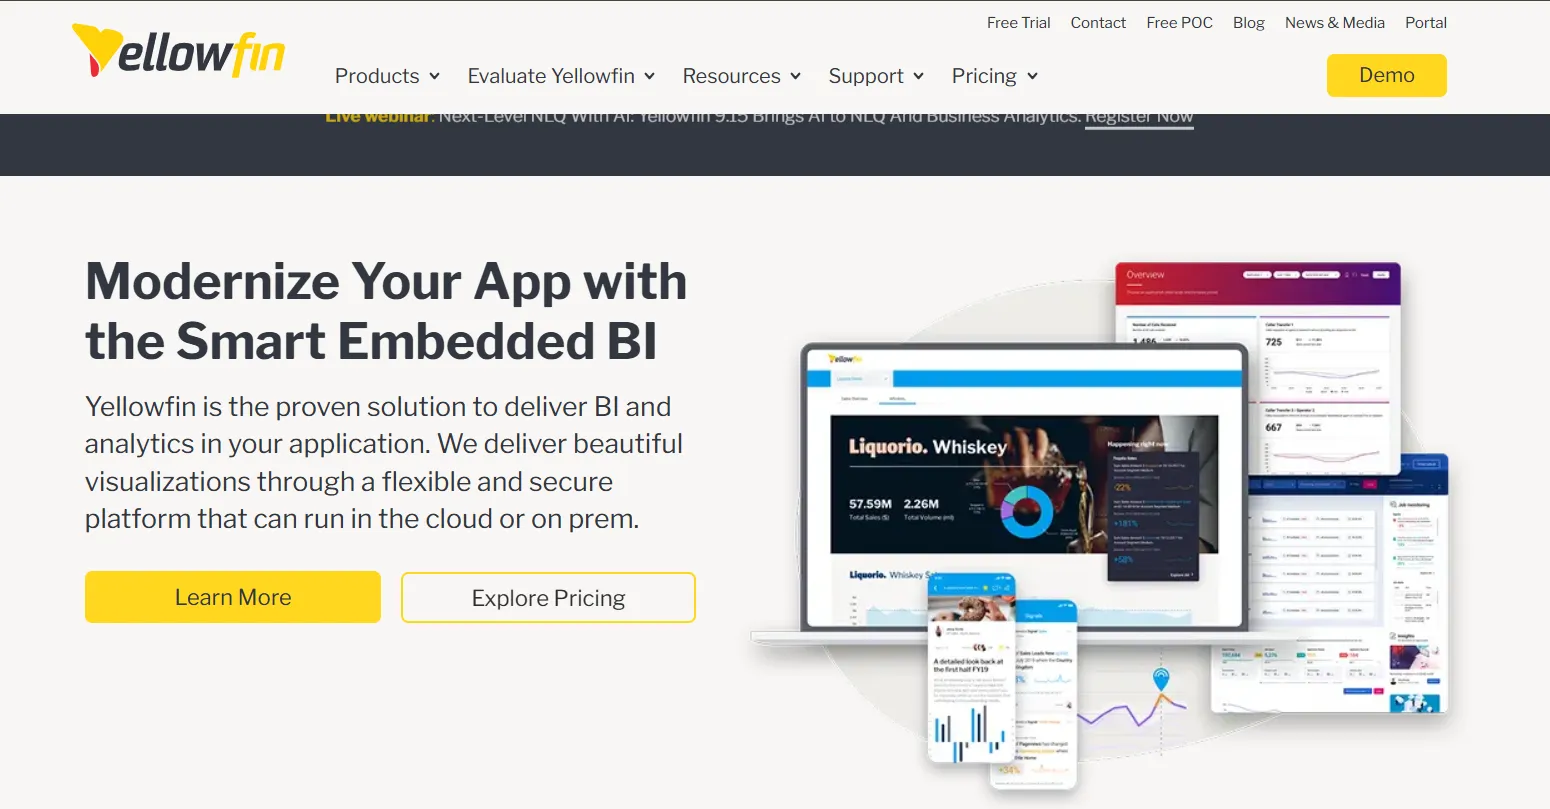
Yellowfin BI offers an end-to-end business intelligence platform, providing reporting, analytics, and data visualization capabilities.
Key Features
- Automated Signals: Proactively alerts users to important changes in data, with no need to manually monitor dashboards.
- Data Storytelling: Combines data visuals with narrative context for clear, compelling communication of insights.
- Augmented Analytics: AI-driven auto-analysis detects trends and outliers with no data science expertise required.
- Interactive Dashboards: Dynamic, real-time dashboards with rich customization options.
Use Cases
Strong choice for organizations that need to communicate insights across non-technical stakeholders through data storytelling.
Notable Users
Honda, Flight Centre, Hertz.
13. GoodData: Analytics Delivery & Embedded BI Platform
GoodData helps companies put smart analytics directly inside their apps and services.
It makes it easier for businesses to use data every day without needing separate business intelligence products.
Key Features
- Composable Analytics: Build custom, reusable analytics components for flexible deployment across teams and apps.
- Headless BI: APIs-first approach lets developers fully control how analytics render within their own applications.
- Advanced ML: Machine learning models for predictive and prescriptive analytics use cases.
- GoodData.CN: Cloud-native version for analytics-as-a-service at scale.
Use Cases
Best for SaaS vendors and large enterprises wanting to embed smart analytics directly into their own products and services.
Notable Users
Zendesk, Zalando, Firehouse Subs, PepsiCo, Unity.
14. Sisense (Fusion Analytics): Full-Stack Embedded BI with AI Everywhere
SiSense is a full-stack business intelligence and analytics tool, best known for its embedded analytics and AI-powered insights.
It uses AI (artificial intelligence) that helps in handling complex data from various sources.
SiSense can be counted as one of the best business intelligence tools for healthcare.
It also effectively serves as a powerful business intelligence reporting tool.
Key Features
- Embed Analytics: Embed analytics directly into EHRs, CRMs, patient portals, and custom business apps.
- AI Everywhere: Pervasive AI across the entire platform from data prep to dashboard narratives.
- No-Code Self-Service BI: Drag-and-drop interface lets any user create reports without technical knowledge.
- 100+ Platform Integrations: Connects to Salesforce, ServiceNow, and 100+ platforms. HIPAA and GDPR compliant.
Use Cases
Particularly strong in healthcare and any industry requiring deeply embedded analytics within existing software products.
Notable Users
Healthcare providers, SaaS companies, and financial institutions.
How to Choose the Right BI Tool for Your Organization
Choosing the right BI platform is more important than choosing the ‘best’ one. Here is a practical framework:
| Factor | What to Ask |
|---|---|
| Your Tech Ecosystem | Are you primarily on Microsoft, Google Cloud, or AWS? Choose Power BI, Looker, or QuickSight, respectively, for maximum integration value. |
| User Technical Level | Do your users know SQL, or are they business analysts? ThoughtSpot and Zoho are better for non-technical users; Mode and Looker suit data engineers. |
| Data Volume & Complexity | Processing millions of rows in real-time? Prioritize MicroStrategy, Qlik, or IBM Cognos. For lighter workloads, Zoho or Domo suffice. |
| Budget Constraints | Power BI starts at $10/user/month. Tableau and Qlik cost significantly more. Always model the total cost of ownership, including training and licensing. |
| Deployment Preference | Need on-premise deployment for compliance? IBM Cognos, MicroStrategy, and SAP BO all support hybrid deployments. |
| Embedded Analytics Need | Building analytics into a product? GoodData and Sisense are purpose-built for this use case. |
Enterprise BI Tools Comparison Table
| Tool | Free Trial | Deployment | Data Sources | AI/ML | Best For |
|---|---|---|---|---|---|
| Microsoft Power BI | Yes | Cloud/On-prem | 100+ | Copilot AI | Microsoft users |
| Tableau | Yes | Cloud/On-prem | 80+ | Einstein AI | Visualization |
| Amazon QuickSight | Yes | Cloud | 30+ | ML Insights | AWS users |
| Google Looker | Yes | Cloud/On-prem | 50+ | Vertex AI | Enterprise |
| Qlik Sense | Yes | Cloud/On-prem | 300+ | Cognitive Engine | Data discovery |
| ThoughtSpot | Yes | Cloud/On-prem | 250+ | SearchIQ/SpotIQ | Self-service |
| Domo | Yes | Cloud | 1000+ | Domo.AI | Real-time teams |
| Zoho Analytics | Yes | Cloud | 40+ | Zia AI | SMBs |
| IBM Cognos | Yes | Cloud/On-prem | 30+ | Watson AI | Enterprise BI |
| MicroStrategy | Yes | Cloud/On-prem | 200+ | HyperIntelligence | Large enterprise |
| SAP BusinessObjects | Limited | Cloud/On-prem | 200+ | Predictive AI | SAP-centric orgs |
| Yellowfin | Yes | Cloud/On-prem | 50+ | Augmented AI | Storytelling |
| GoodData | Yes | Cloud/On-prem | 100+ | Advanced ML | Embedded analytics |
| Sisense | Yes | Cloud/On-prem | 100+ | AI Everywhere | Healthcare/embed |
BI Trends to Watch in 2026
The BI landscape continues to evolve rapidly.
Here are the defining trends shaping enterprise analytics in 2026:
- Prescriptive Analytics Becomes Standard: BI tools are shifting beyond describing what happened and predicting what will happen; they now advise what to do. Platforms integrating prescriptive recommendations will lead the market.
- Embedded BI Displaces Standalone Tools: Analytics are moving inside CRMs, ERPs, and custom applications. Expect continued acquisitions of BI companies by software vendors as embedded analytics becomes the preferred delivery model.
- Conversational Analytics via Natural Language: Every major BI vendor now offers natural language querying. The differentiator in 2026 is accuracy, context understanding, and the ability to take action from a conversation.
- AI Governance and Explainability: As AI insights drive major decisions, organizations demand transparency in how insights are generated. Tools with explainable AI and audit trails are gaining enterprise preference.
- Real-Time Data Pipelines: The lag between data availability and decision-making is shrinking. Streaming analytics and real-time dashboards connected to operational systems are now baseline expectations for enterprise BI.
Common BI Implementation Mistakes to Avoid
- Choosing the ‘Best’ Tool Instead of the Right Tool: The most capable platform often fails if it doesn’t align with your team’s skills, existing infrastructure, or data maturity level. Evaluate fit, not just features.
- Neglecting Data Quality Before Deployment: Even the most powerful BI tool cannot fix poor underlying data. Establish data governance and data quality standards before selecting a platform.
- Underinvesting in Training and Change Management: 73% of BI projects fail to deliver ROI in year one, often due to low user adoption. Invest heavily in training and involve end users early in the process.
- Ignoring Total Cost of Ownership: A $10/month Power BI license can balloon to $100+/user when you add premium features, training, and data engineering costs. Always model TCO before committing.
- Building Without a Metrics Strategy: Dashboards without agreed metric definitions lead to conflicting reports. Define what ‘revenue,’ ‘active users,’ and other KPIs mean organizationally before building.
Conclusion
In 2026, business intelligence is no longer optional; it is a competitive necessity.
Organizations that use BI tools effectively respond faster to market changes, allocate resources more efficiently, and identify opportunities their competitors miss.
Whether you choose the market-leading Microsoft Power BI, the visualization excellence of Tableau, the self-service simplicity of ThoughtSpot, or the embedded analytics power of GoodData and Sisense, the key is alignment: match the tool to your team, your infrastructure, and your data strategy.
| Key Takeaway: Don’t choose the most popular BI tool; choose the right one. Start with your existing technology ecosystem, your users’ technical level, and your data governance maturity. The right BI platform turns data into your most powerful competitive asset. |
FAQ
What are the top BI tools in 2026 by market share?
Microsoft Power BI leads with approximately 20% market share, followed by Tableau at 16.4% and Qlik at ~10%. Over 491,000 companies globally now use at least one BI platform.
What are the key features to consider when selecting a Business Intelligence tool?
When choosing a BI tool, it’s essential to evaluate features such as data integration capabilities, user-friendly interfaces, scalability, real-time analytics, and customization options. Business intelligence software like Tableau and Microsoft Power BI is renowned for its intuitive dashboards and robust data visualization features.
How do cloud-native BI solutions differ from traditional BI tools?
Cloud-native BI tools, such as Amazon QuickSight and Looker, offer advantages like scalability, reduced infrastructure costs, and seamless integration with other cloud services. These business intelligence solutions enable real-time data access and collaboration, which are crucial for modern businesses.
What is OLAP In Business Intelligence?
OLAP is a new technology that is used in BI tools that allows users to quickly analyze and extract insights to provide proper data to the user. It has multi-dimensional analysis and fast query performance to give return results quickly.
Can small to medium-sized businesses (SMBs) effectively utilize BI tools?
Absolutely. BI tools like Zoho Analytics and Domo are tailored for SMBs, offering cost-effective business intelligence solutions with self-service analytics, easy setup, and scalability to grow with the business.
How do AI and machine learning enhance the capabilities of BI tools?
AI and machine learning integrations in BI tools, such as ThoughtSpot and Sisense, enable predictive analytics, natural language querying, and automated insights. These features allow businesses to uncover deeper insights and make data-driven decisions more efficiently. This makes them powerful business intelligence and analytics tools.
Why do most BI implementations fail?
According to current industry data, 73% of BI implementations fail to deliver expected ROI in the first year. The most common reasons are: choosing the wrong tool for the organization’s maturity level, poor data quality, insufficient user training, and lack of executive sponsorship.