Table of Contents
Why Analytics Matters in the Data-Driven Era
Businesses generate more data in a single day than entire organizations produced in a year just a decade ago.
From customer clicks and social media interactions to supply chain movements and financial transactions, data flows from every corner of modern enterprise.
But here’s the challenge: data without analysis is just noise.
That’s where analytics comes in.
While data represents raw, unprocessed facts and figures, analytics make it easier to understand by examining, transforming, and modeling it to discover meaningful patterns, conclude, and support decision-making.
Understanding the different types of data analytics isn’t just a technical skill; it’s a strategic imperative.
Whether you’re a business leader trying to understand customer behavior, a marketer optimizing campaign performance, or a healthcare professional predicting patient outcomes, knowing which analytical approach to use can mean the difference between insight and confusion, between competitive advantage and falling behind.
In this comprehensive guide, we’ll explore the complete spectrum of analytics types, from foundational descriptive methods to cutting-edge AI-driven approaches, helping you make smarter, faster, and more informed decisions.

What Is Data Analytics?
Data analytics is the science and art of examining raw data to extract meaningful insights, identify patterns, and support informed decision-making.
It combines statistical analysis, computational algorithms, and domain expertise to transform raw data into actionable intelligence.
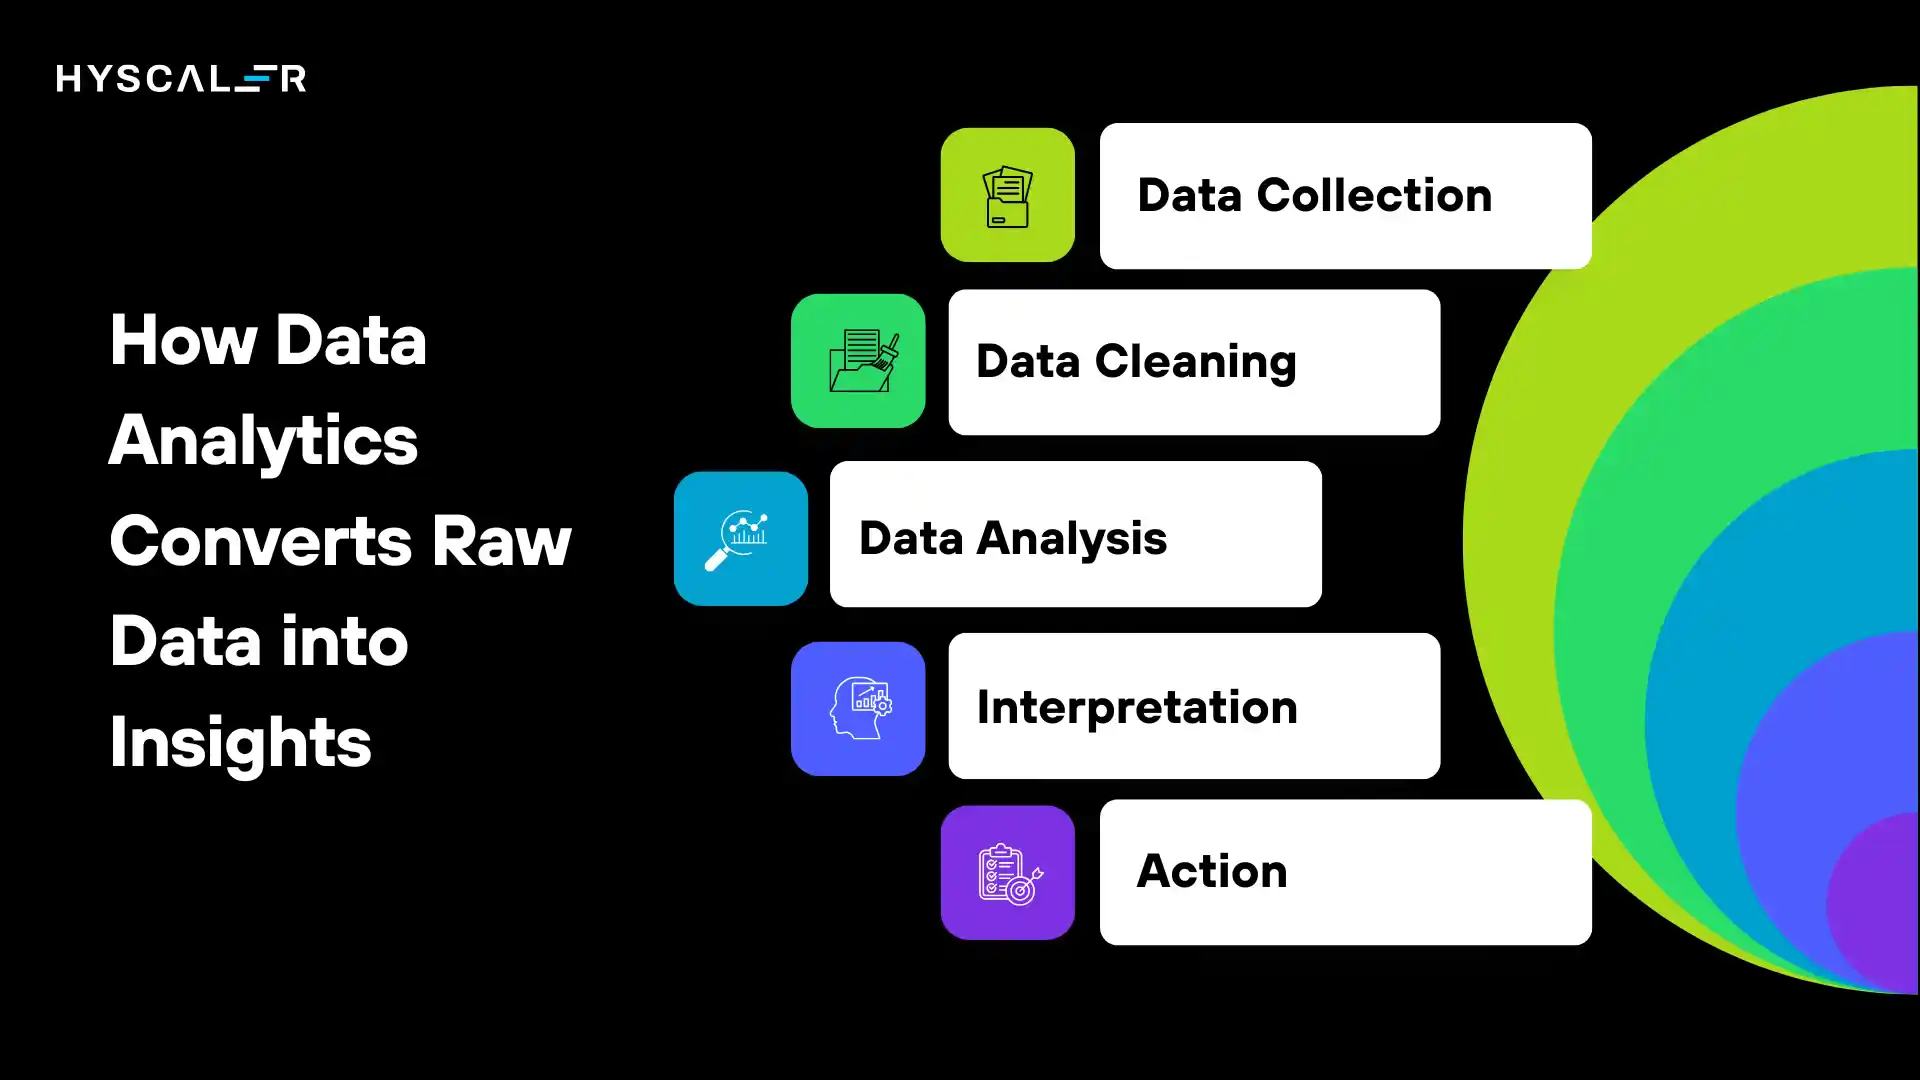
How Data Analytics Converts Raw Data into Insights
The analytics process typically follows this flow:
- Data Collection: Gathering relevant information from various sources
- Data Cleaning: Removing errors, duplicates, and inconsistencies
- Data Analysis: Applying statistical methods, algorithms, or models
- Interpretation: Translating results into a business context
- Action: Making decisions based on discovered insights
Real-World Use Cases
Business: Retailers analyze purchase patterns to optimize inventory levels and reduce waste by up to 30%.
Marketing: Companies examine campaign performance data to identify which channels deliver the highest ROI, often finding that 20% of their efforts drive 80% of results.
Healthcare: Hospitals use patient data analytics to predict readmission risks, improving care quality while reducing costs.
Finance: Banks leverage analytics to detect fraudulent transactions in real-time, preventing billions in losses annually.
Types of Analytics: A Complete Overview
Data analytics isn’t a one-size-fits-all discipline.
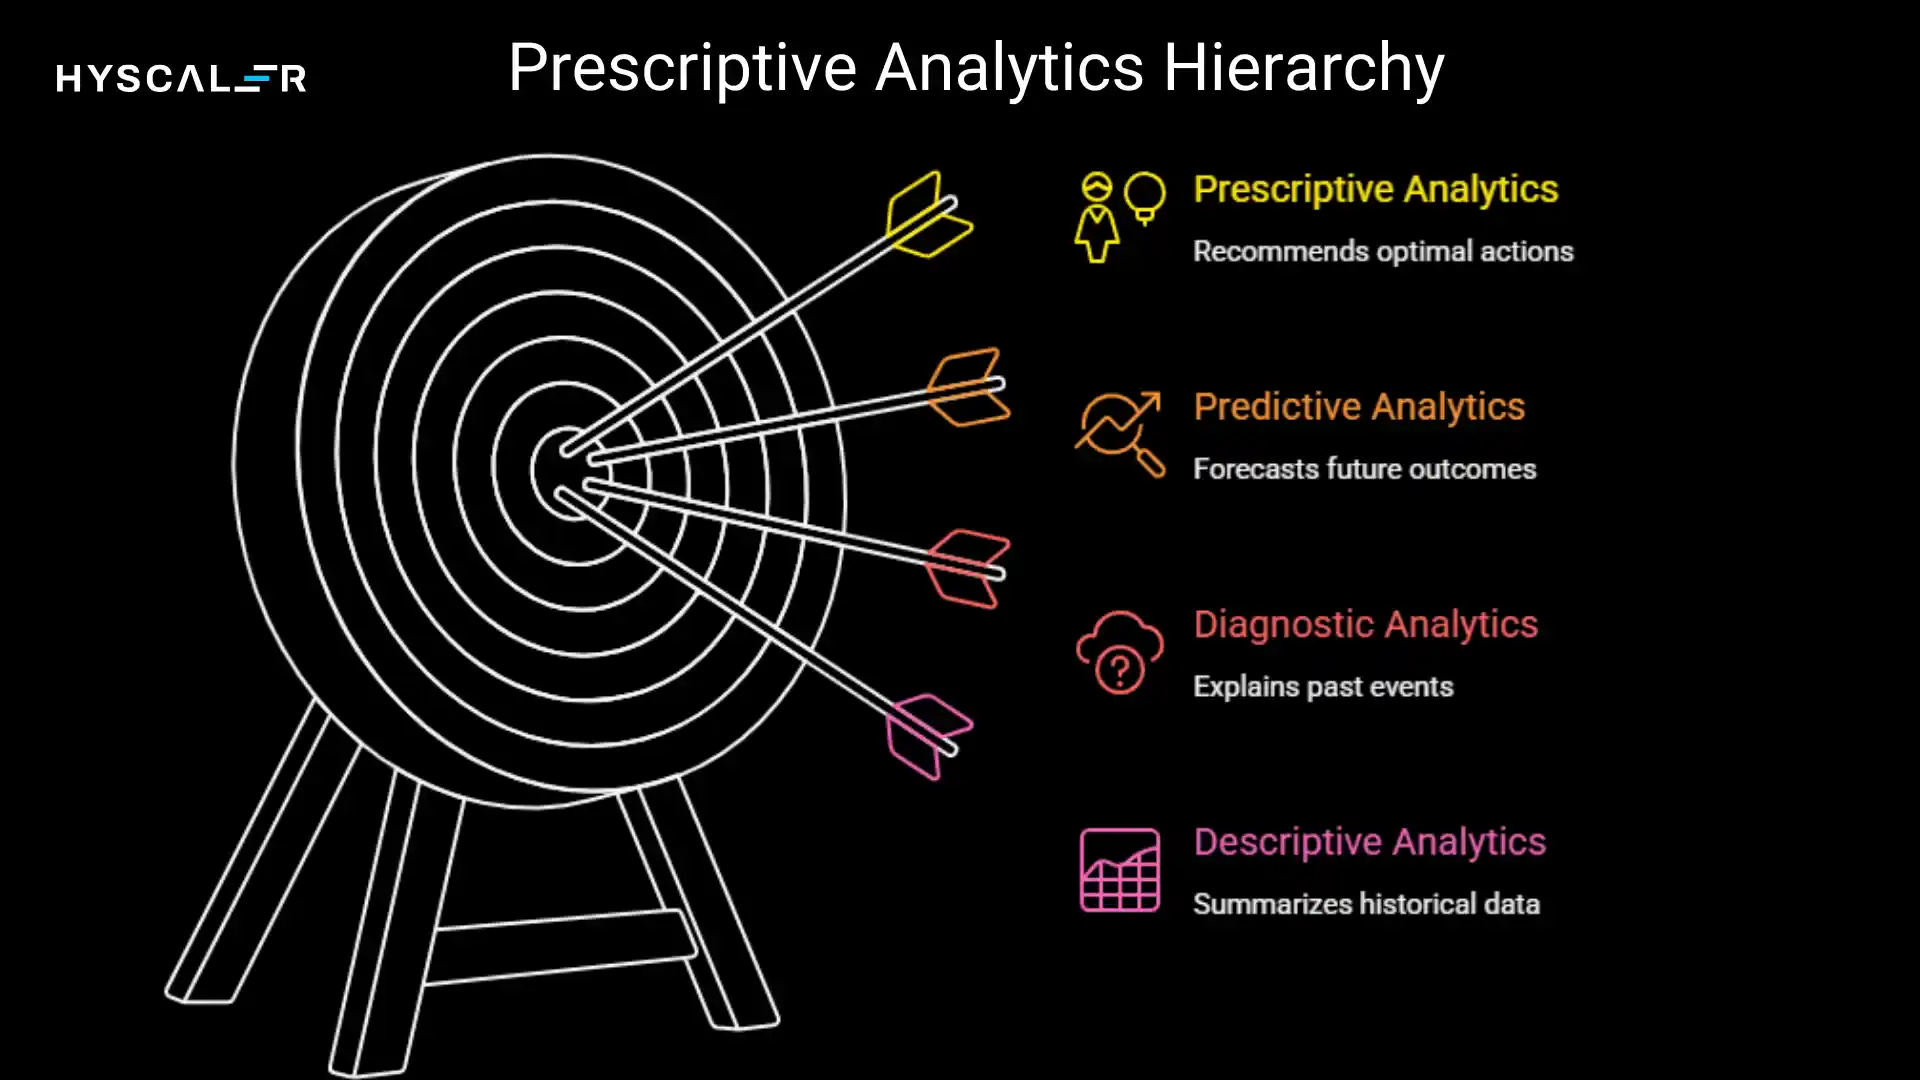
Experts commonly categorize analytics into four main types, each serving a distinct purpose and answering different business questions:
| Analytics Type | Key Question | Time Focus | Complexity |
| Descriptive | What happened? | Past | Low |
| Diagnostic | Why did it happen? | Past | Medium |
| Predictive | What will happen? | Future | High |
| Prescriptive | What should we do? | Future | Very High |
Each type builds upon the previous one, creating a maturity ladder that organizations climb as their analytical capabilities evolve.
Understanding these types of data analytics helps businesses select the right approach for their specific needs and capabilities.
Descriptive Analytics: What Happened?
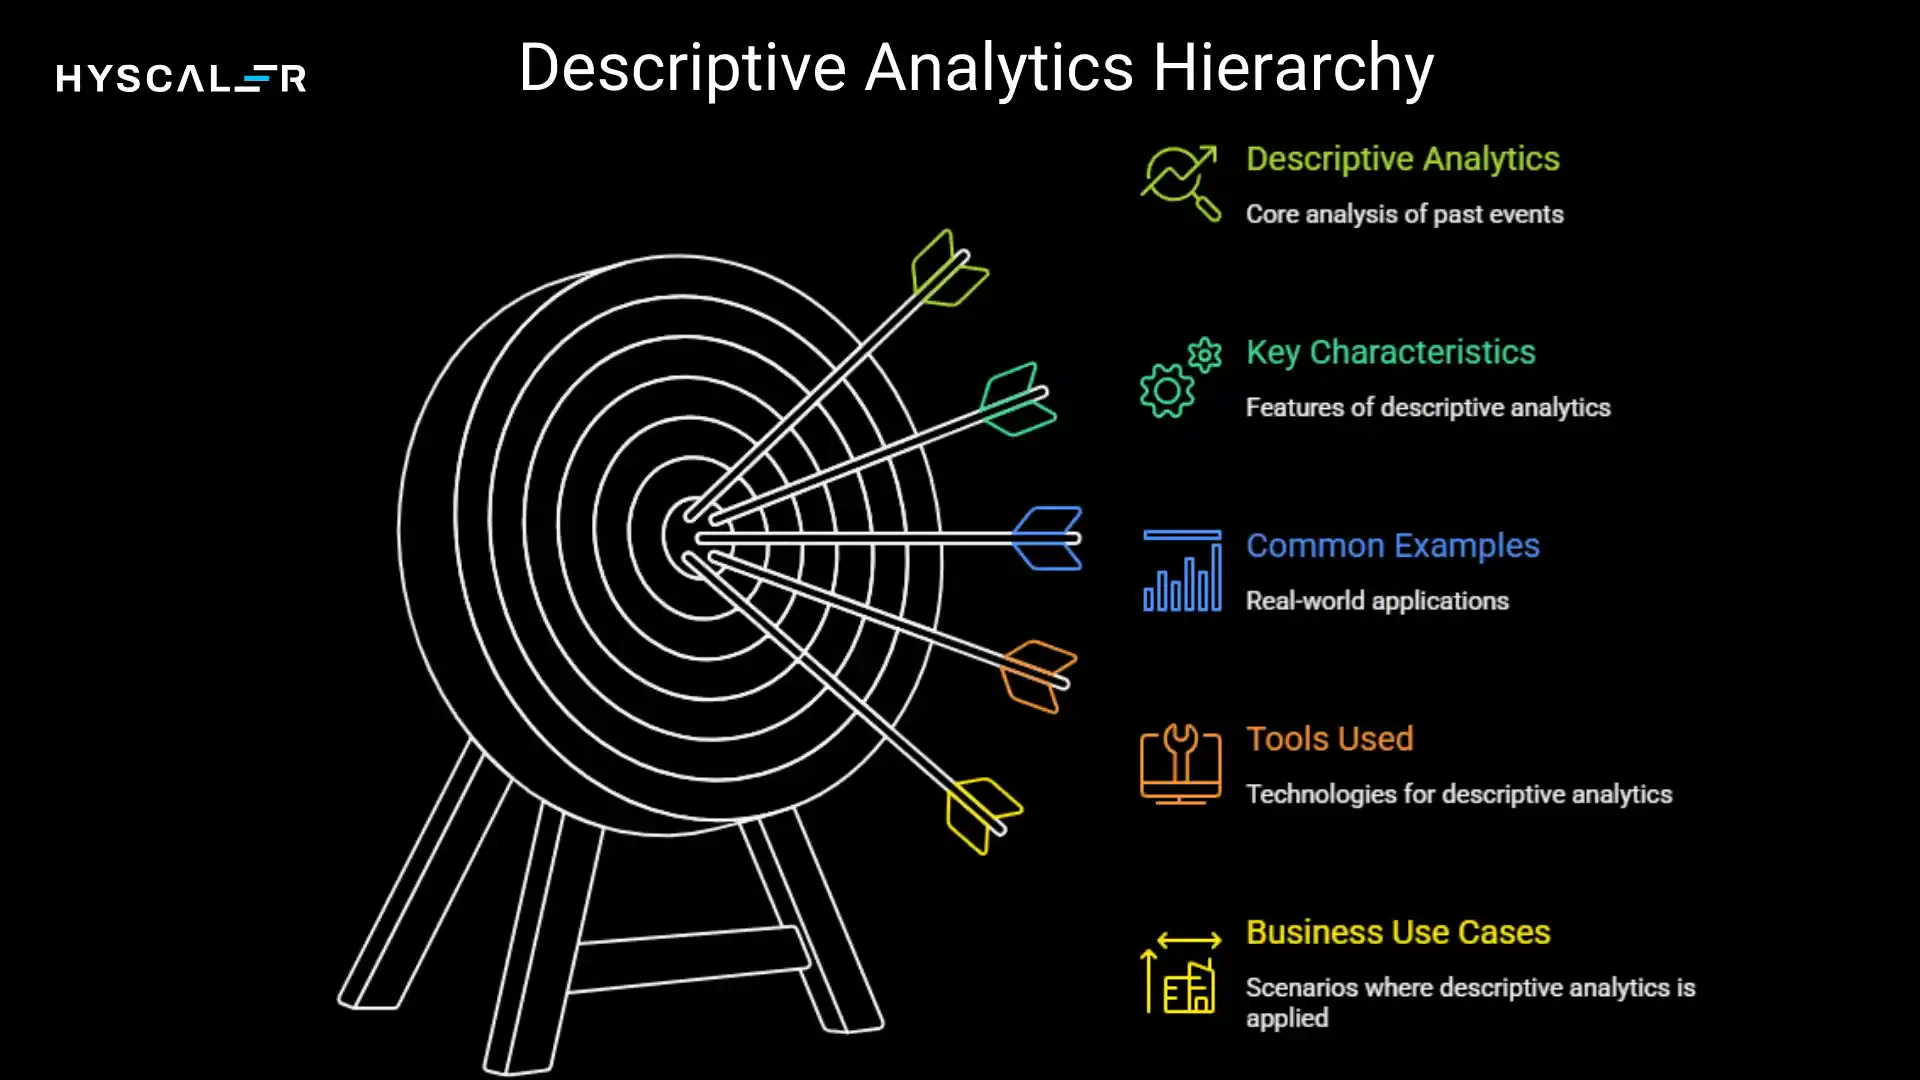
Descriptive analytics examines historical data to understand what has already occurred.
It’s the most fundamental form of data analysis, serving as the foundation upon which all other analytical methods are built.
Key Characteristics
- Backward-looking: Focuses exclusively on past events
- Aggregation-based: Summarizes large datasets into digestible metrics
- Report-oriented: Presents findings through dashboards, charts, and KPIs
- Accessible: Requires minimal technical expertise to understand
Common Examples
- Monthly sales reports showing revenue by product, region, or time period
- Website analytics dashboards displaying page views, bounce rates, and session duration
- Financial statements summarizing profit, loss, and cash flow
- KPI scorecards track metrics like customer satisfaction or employee productivity
Tools Used
Popular descriptive analytics tools include:
- Microsoft Excel and Google Sheets
- Tableau and Power BI for visualization
- Google Analytics for web traffic
- SQL databases for querying historical records
Business Use Cases
A retail chain might use descriptive analytics to discover that summer clothing sales peaked in June but dropped 40% in July.
An e-commerce platform could analyze last quarter’s data to find that mobile users accounted for 65% of traffic but only 35% of conversions.
Why It’s the Foundation of All Types of Data Analytics
You can’t predict the future or prescribe solutions without first understanding the past.
Descriptive analytics provides the baseline knowledge necessary for more advanced analysis.
It answers the critical first question: “What actually happened?”
Only after establishing this foundation can organizations move to asking why, what’s next, and what to do about it.
Diagnostic Analytics: Why Did It Happen?
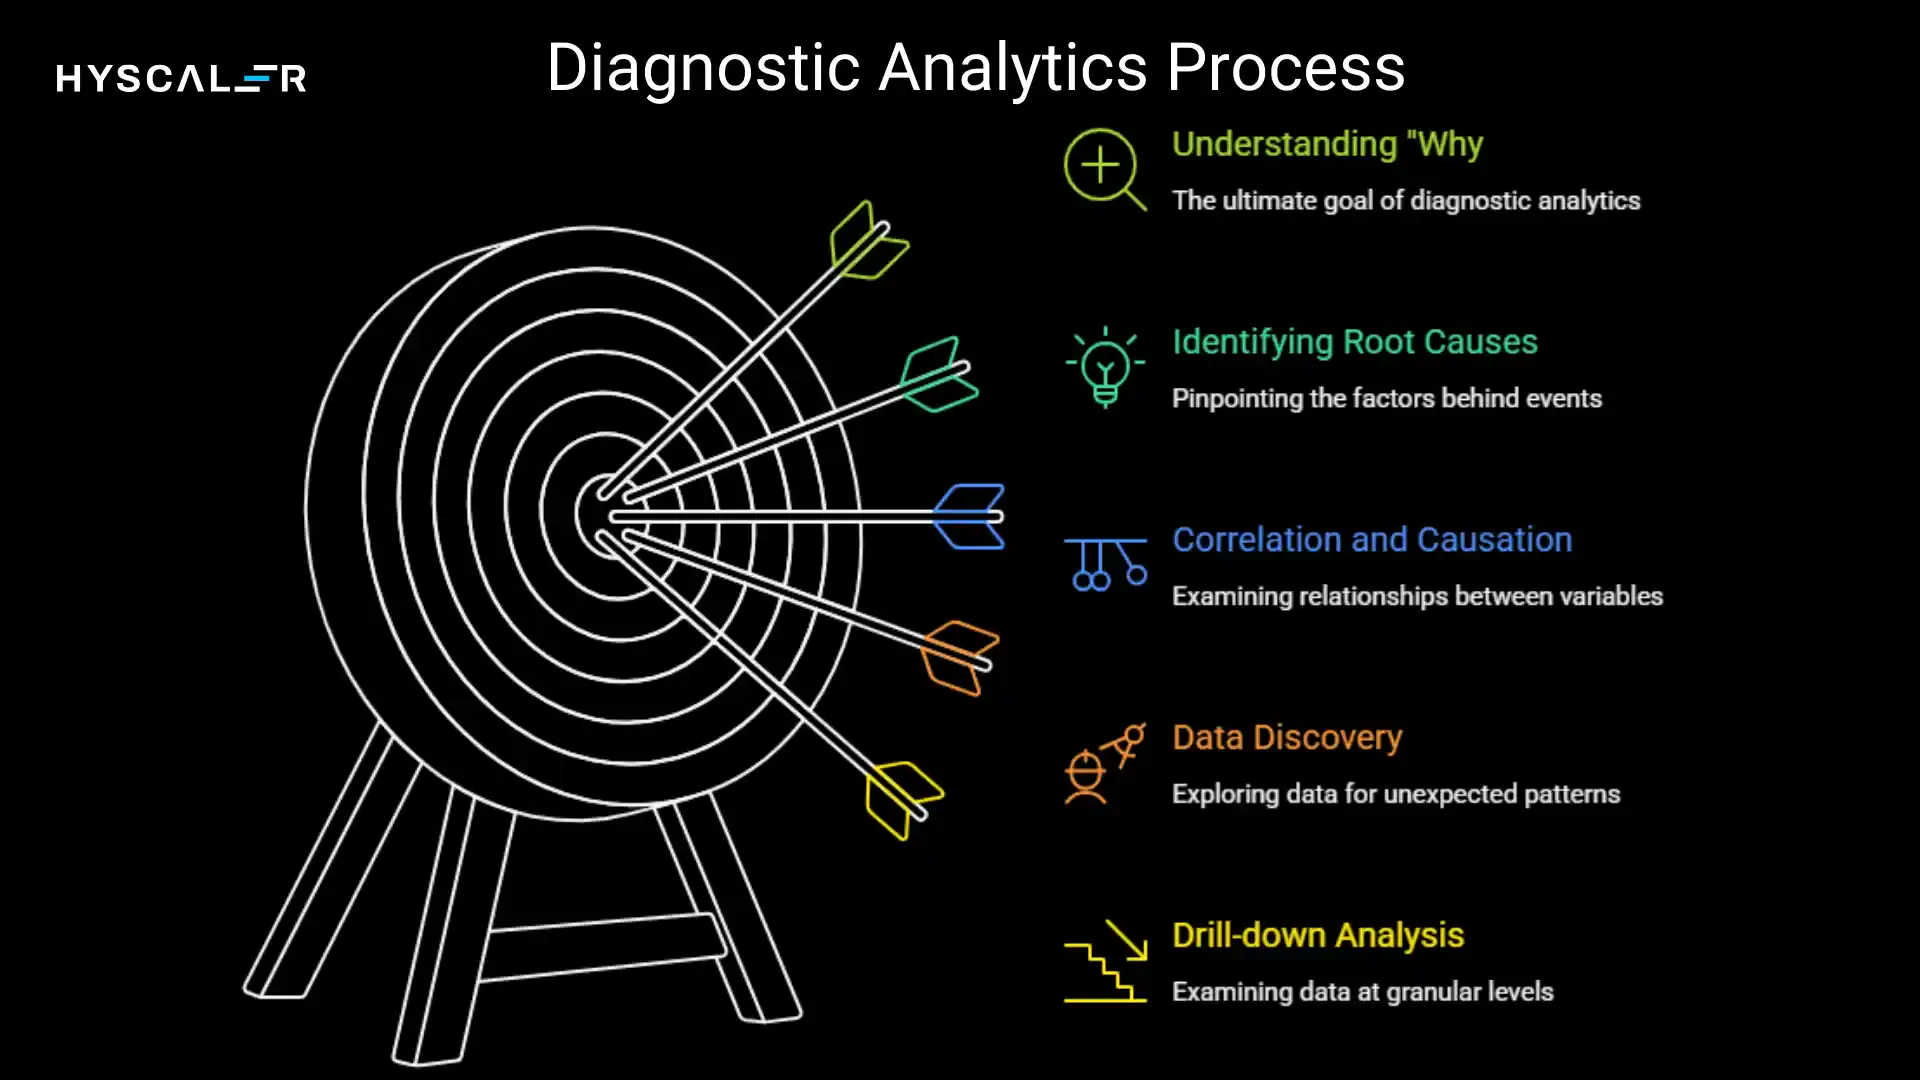
While descriptive analytics tells you what happened, diagnostic analytics digs deeper to uncover why it happened.
This type of analysis identifies the root causes behind patterns, anomalies, and trends in your data.
Definition and Purpose
Diagnostic analytics uses techniques like data drilling, correlation analysis, and data discovery to explore relationships between variables and identify causal factors. It transforms observations into explanations.
Techniques Used
Drill-down analysis: Starting with high-level data and progressively examining more granular details. For example, if overall sales declined, you might drill down by region, then by store, then by product category to find the source.
Data discovery: Exploring datasets without predetermined hypotheses to uncover unexpected relationships or patterns.
Correlation and causation analysis: Identifying which variables move together and, more importantly, which ones actually influence each other.
Examples in Marketing, Sales, and Operations
Marketing: A company notices its email open rates dropped 25% last month. Diagnostic analytics reveals that a change in subject line format, combined with sending emails at a different time, caused the decline.
Sales: After quarterly revenue fell short of targets, analysis shows that the drop was concentrated in the enterprise segment, specifically among customers who had experienced longer-than-usual onboarding times.
Operations: A manufacturing plant investigates why defect rates spiked.
Diagnostic analysis traces the issue to a specific supplier’s raw materials that were delivered during two weeks.
Difference Between Descriptive and Diagnostic Analytics
The distinction is straightforward: descriptive analytics reports that your customer churn rate increased to 15% last quarter (the what), while diagnostic analytics discovers that the increase was driven by dissatisfaction with your new pricing model among small business customers (the why).
Descriptive is observational; diagnostic is investigative.
Together, they provide a complete picture of your historical performance.
Predictive Analytics: What Is Likely to Happen?
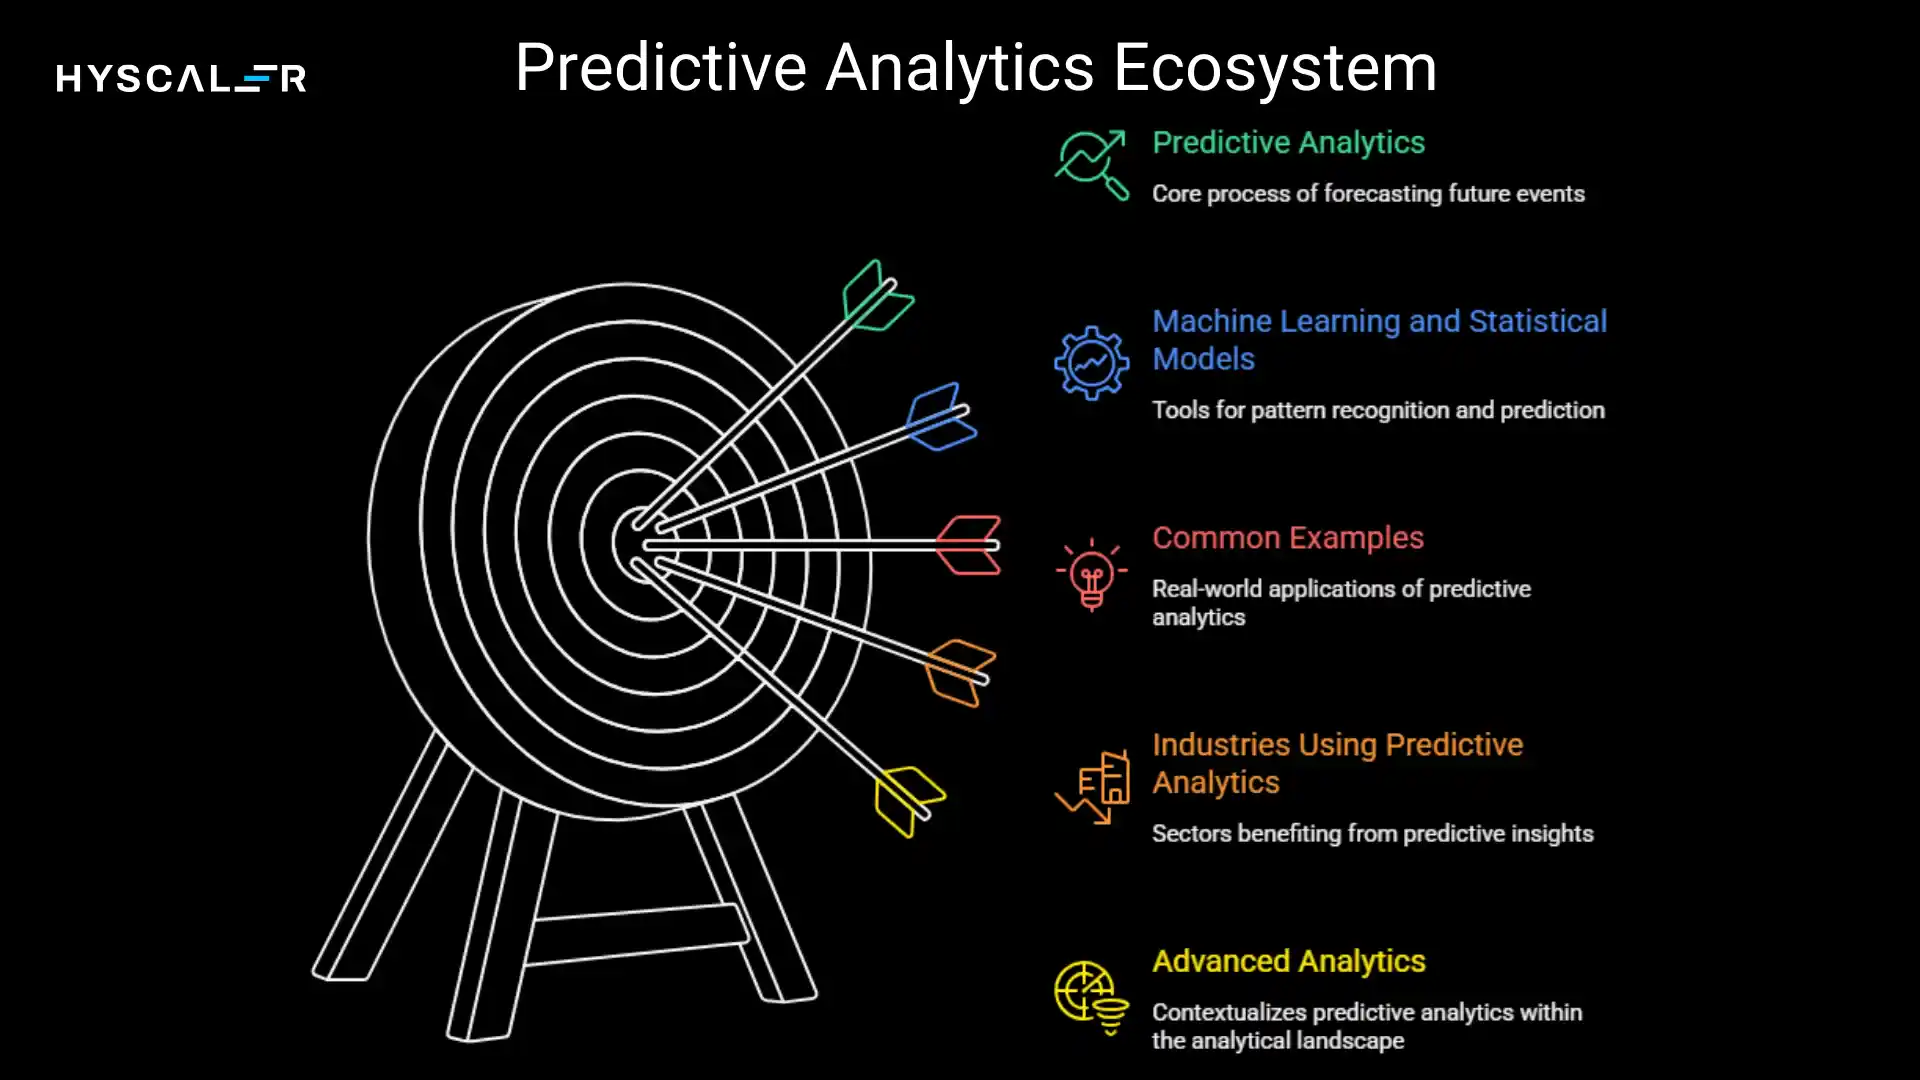
Predictive analytics shifts focus from the past to the future, using historical data, statistical algorithms, and machine learning techniques to forecast what’s likely to happen next.
Definition of Predictive Analytics
Predictive analytics employs mathematical models to identify patterns in historical and current data, then extrapolates those patterns to make informed predictions about future events, behaviors, or outcomes.
Role of Machine Learning and Statistical Models
Modern predictive analytics leverages:
- Regression models that identify relationships between variables
- Time series analysis for forecasting based on temporal patterns
- Classification algorithms that categorize data into predicted outcomes
- Machine learning models that improve accuracy as they process more data
- Neural networks for complex pattern recognition
These tools don’t provide certainty; they estimate probability.
A predictive model might indicate there’s an 80% chance a customer will churn within 90 days or a 65% probability that demand for a product will increase next quarter.
Common Predictive Analytics Examples
Customer churn prediction: Telecommunications companies identify subscribers likely to cancel their service, enabling proactive retention efforts.
Demand forecasting: Retailers predict product demand to optimize inventory, reducing both stockouts and excess inventory costs.
Credit risk assessment: Banks evaluate the likelihood that loan applicants will default based on historical patterns from similar borrowers.
Predictive maintenance: Manufacturers anticipate equipment failures before they occur, scheduling maintenance during planned downtime rather than experiencing costly breakdowns.
Industries Using Predictive Analytics
Healthcare organizations predict patient readmission risks and disease progression.
Insurance companies forecast claim likelihood and assess policyholder risk.
E-commerce platforms recommend products based on predicted customer preferences.
Financial institutions detect potentially fraudulent transactions before they’re completed.
How It Fits Into Advanced Types of Analytics
Predictive analytics represents a significant leap in analytical sophistication.
While descriptive and diagnostic analytics look backward, predictive analytics look forward, enabling proactive rather than reactive decision-making.
It bridges understanding the past and prescribing actions for the future, making it one of the most valuable types of data analytics for competitive advantage.
Prescriptive Analytics: What Should Be Done?
Prescriptive analytics represents the pinnacle of analytical sophistication.
It doesn’t just predict what will happen, it recommends what you should do about it.
Definition and Explanation
Prescriptive analytics combines insights from descriptive, diagnostic, and predictive analytics with business rules, algorithms, and computational models to suggest optimal actions. It evaluates multiple possible outcomes and recommends the best course of action based on defined objectives and constraints.
How Prescriptive Analytics Builds on Predictive Analytics
While predictive analytics might forecast that demand for a product will increase by 30% next quarter, prescriptive analytics goes further by recommending exactly how much inventory to order, when to order it, which suppliers to use, and how to allocate it across distribution centers to maximize profit while minimizing costs and stockout risk.
The progression is clear: predict the future, then prescribe the optimal response.
Role of AI, Optimization, and Automation
Prescriptive analytics relies heavily on:
Artificial intelligence to process vast amounts of data and identify non-obvious solutions
Optimization algorithms that evaluate thousands or millions of possible scenarios to find the best outcome
Simulation models that test different strategies in virtual environments before real-world implementation
Automation that can execute recommended actions without human intervention when appropriate
Real-World Examples
Dynamic pricing: Airlines and hotels adjust prices in real-time based on demand predictions, competitor pricing, remaining inventory, and customer willingness to pay, maximizing revenue per seat or room.
Supply chain optimization: Logistics companies determine optimal delivery routes considering traffic patterns, fuel costs, delivery windows, and vehicle capacity, reducing costs while improving service.
Personalized recommendations: Streaming services don’t just predict what you might like, they prescribe what to watch next based on your viewing history, time of day, device, and even mood indicators, optimizing for engagement.
Treatment protocols: Healthcare systems recommend personalized treatment plans based on patient characteristics, predicted outcomes for different interventions, and resource availability.
Other Types of Data Analytics You Should Know
Beyond the four primary categories, several specialized types of data analytics have emerged to address specific business needs and technological capabilities.
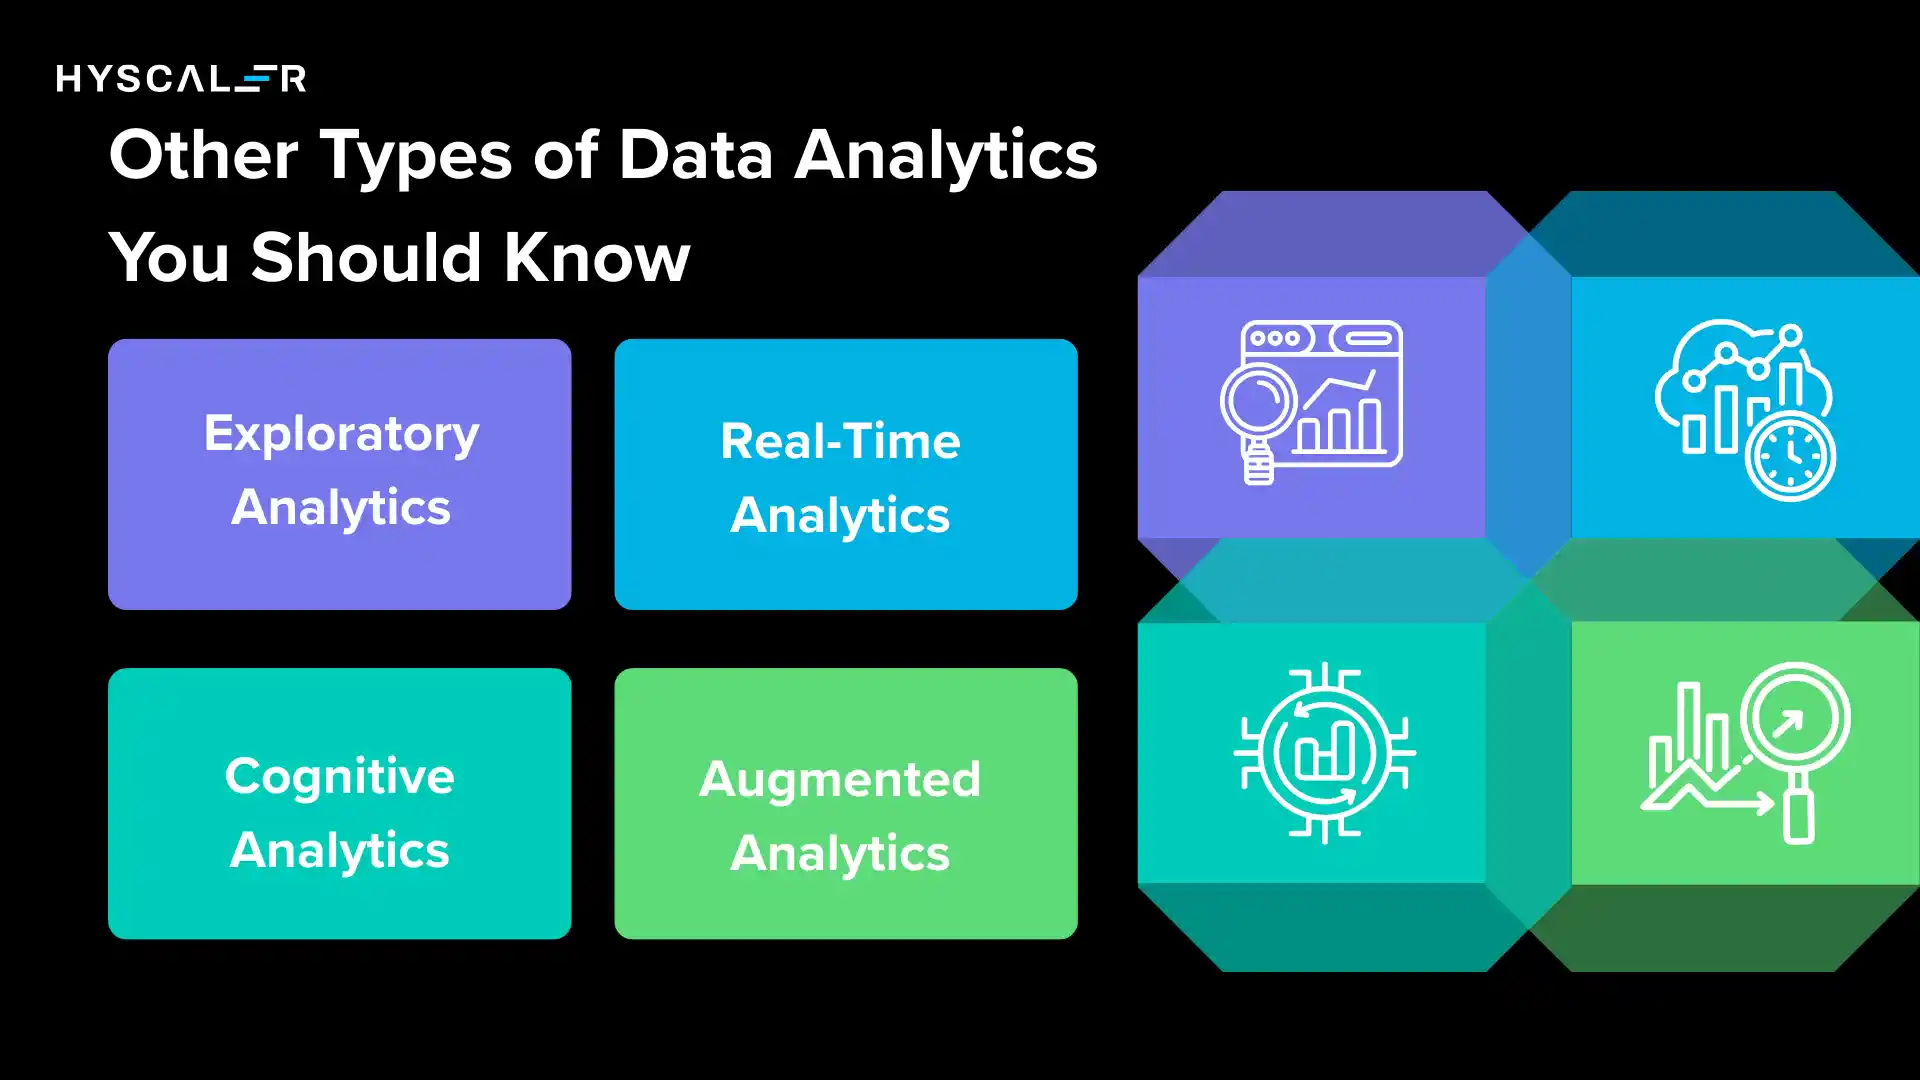
Exploratory Analytics
Exploratory analytics involves investigating datasets without predefined hypotheses or assumptions.
Data scientists “explore” information to discover unexpected patterns, relationships, or anomalies that might warrant further investigation.
Unlike diagnostic analytics, which investigates known questions, exploratory analytics asks, “What interesting things might be hidden in this data?”
It’s particularly valuable when entering new markets, analyzing unfamiliar datasets, or seeking innovation opportunities.
Real-Time Analytics
Real-time analytics processes and analyzes data as it’s created, delivering insights within seconds or milliseconds.
This enables immediate decision-making and rapid responses to changing conditions.
Financial trading platforms use real-time analytics to execute trades based on market movements.
Fraud detection systems analyze transactions as they occur, blocking suspicious activity before it completes.
Website personalization engines adjust content dynamically based on user behavior in the current session.
The key differentiator is speed: batch analytics might process yesterday’s data overnight, while real-time analytics processes this second’s data right now.
Cognitive Analytics
Cognitive analytics applies artificial intelligence technologies that mimic human thought processes to data analysis.
It can understand natural language, recognize patterns like a human would, learn from interactions, and even reason through ambiguous situations.
Chatbots that understand customer intent, sentiment analysis tools that gauge emotional tone in text, and image recognition systems that identify objects in photos all represent cognitive analytics in action.
Augmented Analytics
Augmented analytics uses machine learning and AI to automate data preparation, insight generation, and insight explanation.
It makes analytics more accessible to non-technical users by automatically identifying significant patterns, anomalies, and trends, then explaining them in plain language.
Modern business intelligence platforms increasingly incorporate augmented analytics, automatically highlighting “what’s changed,” “what’s unusual,” or “what you should know” without requiring users to build complex queries or understand statistical methods.
Types of Analytics by Business Function
Different departments leverage various types of data analytics to address their unique challenges and objectives.
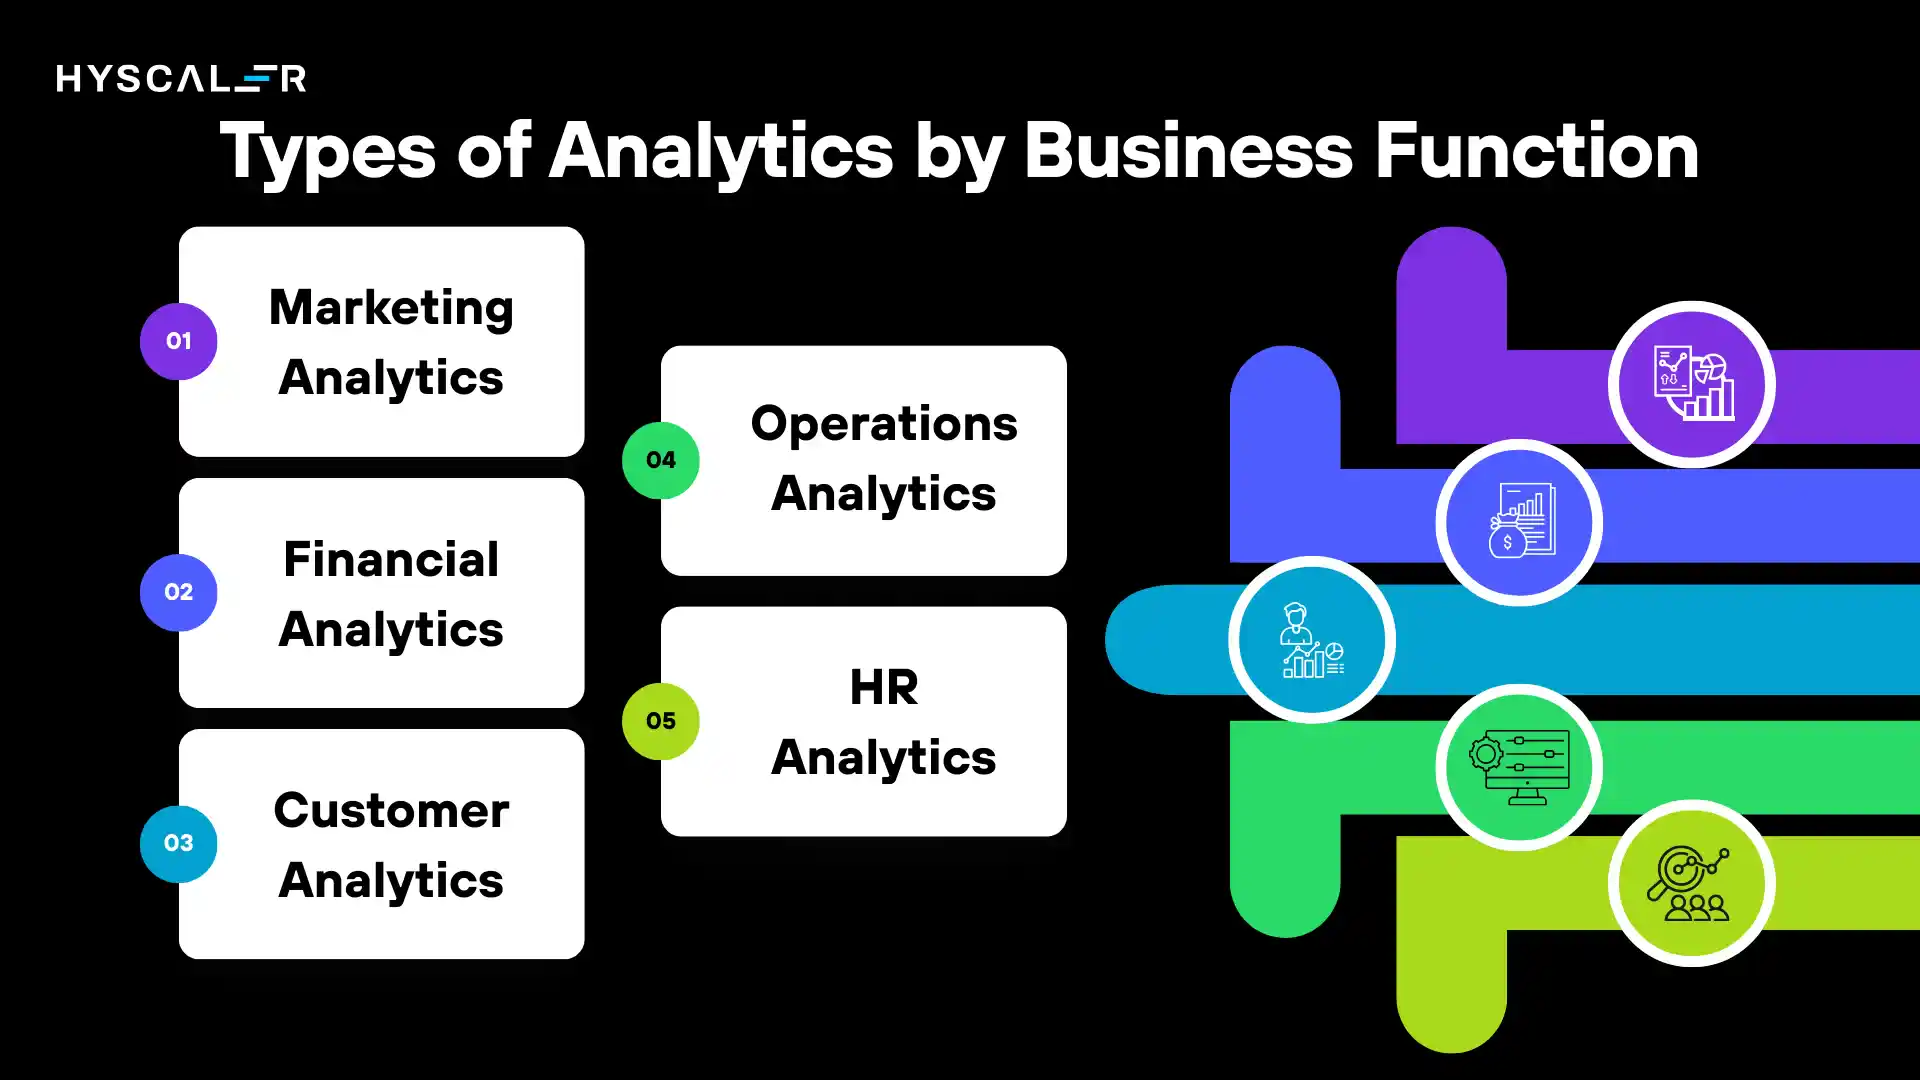
Marketing Analytics
Marketing teams employ all analytics types to optimize campaigns and customer engagement.
They use descriptive analytics to track campaign performance, diagnostic analytics to understand why certain messages resonate, predictive analytics to forecast campaign ROI, and prescriptive analytics to determine optimal budget allocation across channels.
Financial Analytics
Finance departments rely on analytics for budgeting, forecasting, risk management, and compliance.
Descriptive analytics tracks historical financial performance, diagnostic analytics investigates variances from budgets, predictive analytics forecasts future revenue and expenses, and prescriptive analytics optimizes capital allocation and investment strategies.
Customer Analytics
Customer-focused analytics examines behavior patterns, preferences, and lifetime value.
Organizations analyze purchase history, engagement metrics, support interactions, and demographic data to segment customers, predict churn, personalize experiences, and maximize customer lifetime value.
Operations Analytics
Operations teams use analytics to improve efficiency, reduce costs, and enhance quality.
They track production metrics, identify bottlenecks, predict maintenance needs, and optimize resource allocation.
Supply chain analytics, a subset of operations analytics, focuses specifically on procurement, inventory, logistics, and distribution.
HR Analytics
Human resources departments leverage people analytics to improve recruiting, retention, performance, and employee satisfaction.
They analyze hiring patterns, predict turnover risk, identify high performers, and prescribe interventions to improve engagement and productivity.
Each functional area applies the same fundamental analytics types but tailors them to domain-specific questions, data sources, and success metrics.
Types of Data Analytics Tools and Technologies
The right tools enable effective analytics.
Here’s an overview of the technology landscape:
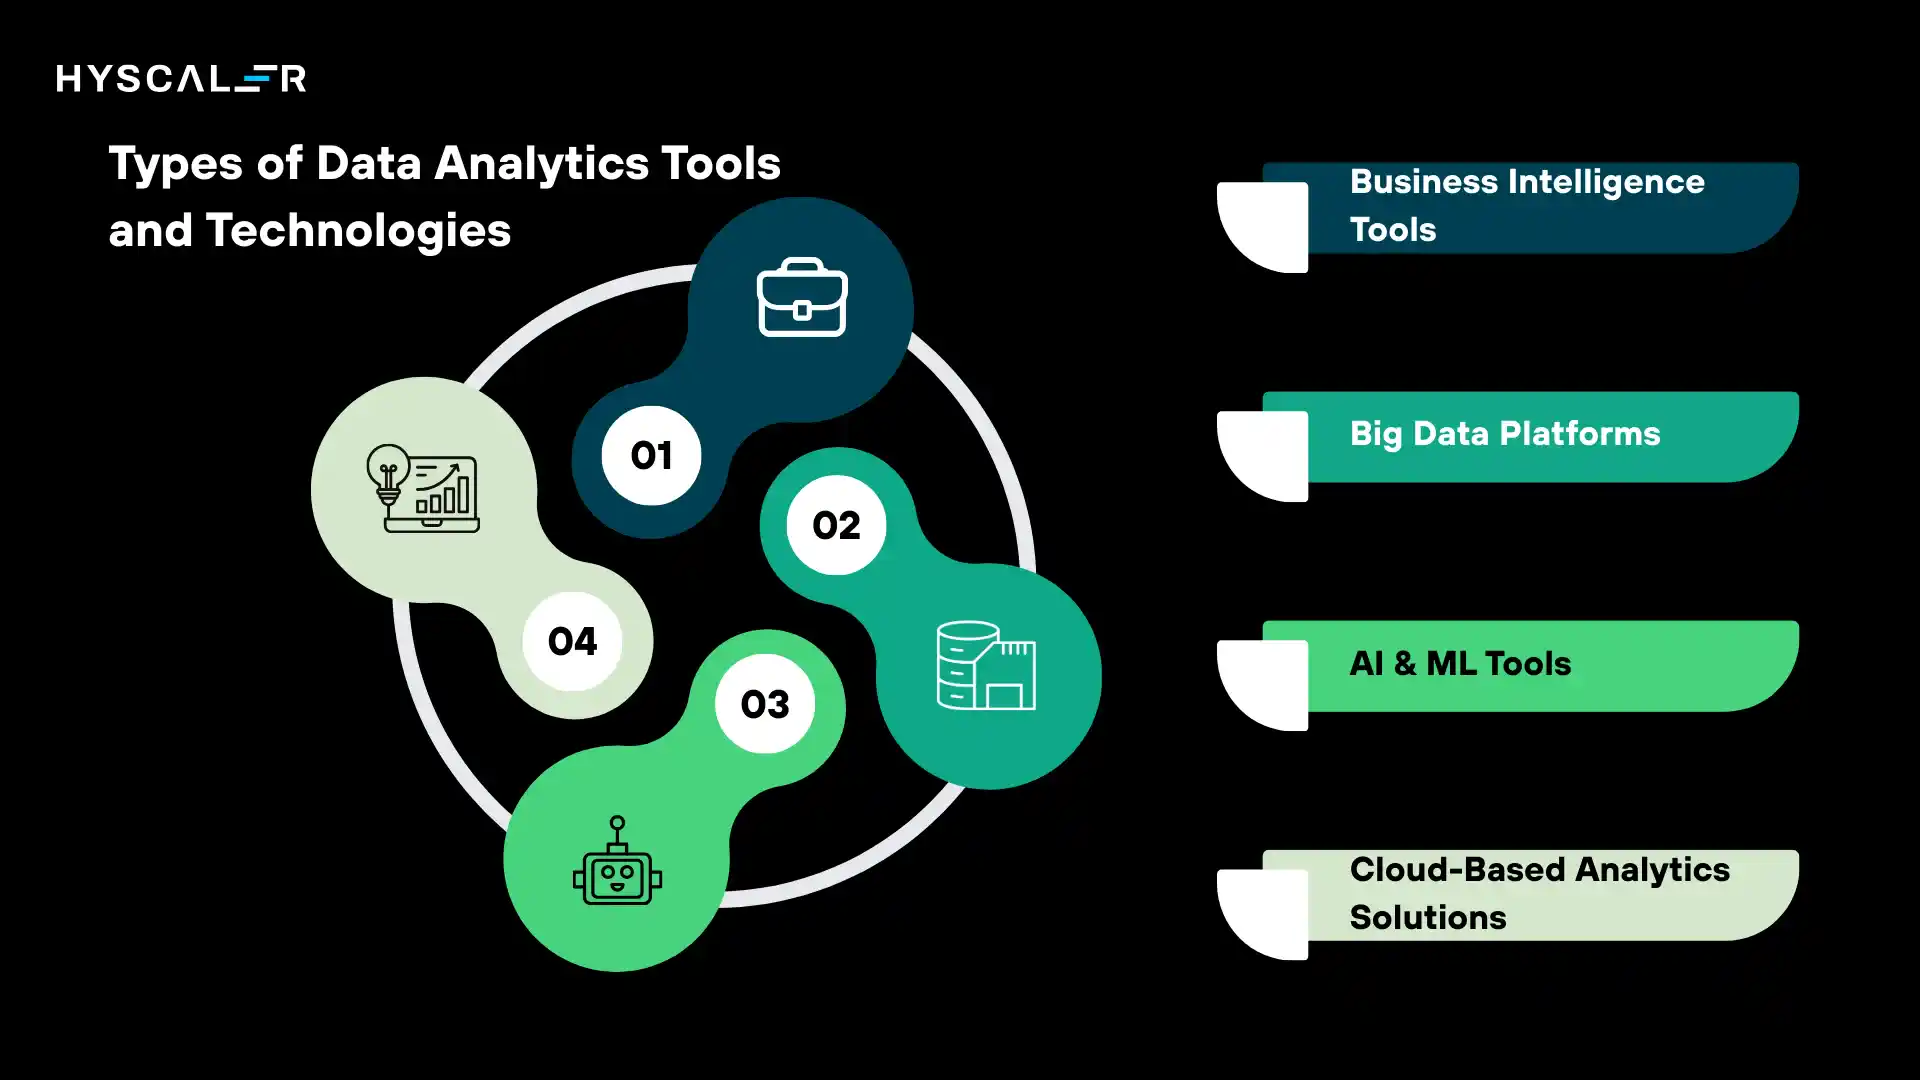
BI (Business Intelligence) Tools
Business intelligence platforms help organizations visualize data, create reports, and build dashboards.
Leading tools include Tableau, Microsoft Power BI, Qlik Sense, and Looker.
These platforms excel at descriptive analytics and increasingly incorporate predictive capabilities.
Big Data Platforms
When data volume, velocity, or variety exceeds traditional database capabilities, big data platforms step in.
Apache Hadoop, Apache Spark, and cloud-based solutions like Google BigQuery and Amazon Redshift process massive datasets efficiently, enabling analytics at scale.
AI & ML Tools
Machine learning platforms like TensorFlow, PyTorch, and scikit-learn enable predictive and prescriptive analytics.
Cloud providers offer managed ML services (AWS SageMaker, Google Cloud AI Platform, Azure Machine Learning) that reduce the technical complexity of building and deploying models.
Cloud-Based Analytics Solutions
Cloud platforms (AWS, Google Cloud, Microsoft Azure) provide comprehensive analytics ecosystems combining data storage, processing, analysis, and visualization.
They offer scalability, flexibility, and integrated toolsets that would be prohibitively expensive to build on-premises.
The trend is clear: analytics tools are becoming more powerful, more automated, and more accessible to non-technical users, democratizing data-driven decision-making across organizations.
How to Choose the Right Type of Analytics for Your Business
Selecting the appropriate analytical approach requires aligning your business objectives, data maturity, and resources.
Business Goals vs Analytics Type Mapping
If your goal is understanding current performance, start with descriptive analytics. Build dashboards and reports that provide visibility into key metrics.
If you need to understand root causes, implement diagnostic analytics. Investigate why metrics changed and what factors drive outcomes.
If you want to anticipate future trends, invest in predictive analytics. Forecast demand, identify risks, and prepare for likely scenarios.
If you require optimal decision recommendations, pursue prescriptive analytics. Leverage AI and optimization to identify the best courses of action.
Most organizations need multiple types simultaneously, but starting with descriptive and diagnostic analytics builds the foundation for more advanced approaches.
Data Maturity Considerations
Assess your organization’s analytical readiness:
- Data quality: Is your data clean, consistent, and reliable?
- Data infrastructure: Can your systems handle the required processing?
- Analytical skills: Does your team have the necessary expertise?
- Data culture: Does your organization make decisions based on data?
Attempting prescriptive analytics without solid descriptive and diagnostic capabilities often leads to sophisticated-sounding recommendations built on flawed foundations.
Cost and Scalability Factors
Descriptive analytics typically requires the lowest investment, and basic BI tools and SQL knowledge often suffice.
Predictive and prescriptive analytics demand more expensive tools, specialized expertise (data scientists, ML engineers), and greater computational resources.
Consider starting with high-value, lower-complexity use cases to demonstrate ROI before expanding to more ambitious projects.
Cloud-based solutions offer the advantage of scaling incrementally, paying only for resources you use.
Future of Data Analytics: What’s Next?
The analytics landscape continues evolving rapidly.
Several trends are shaping the future:
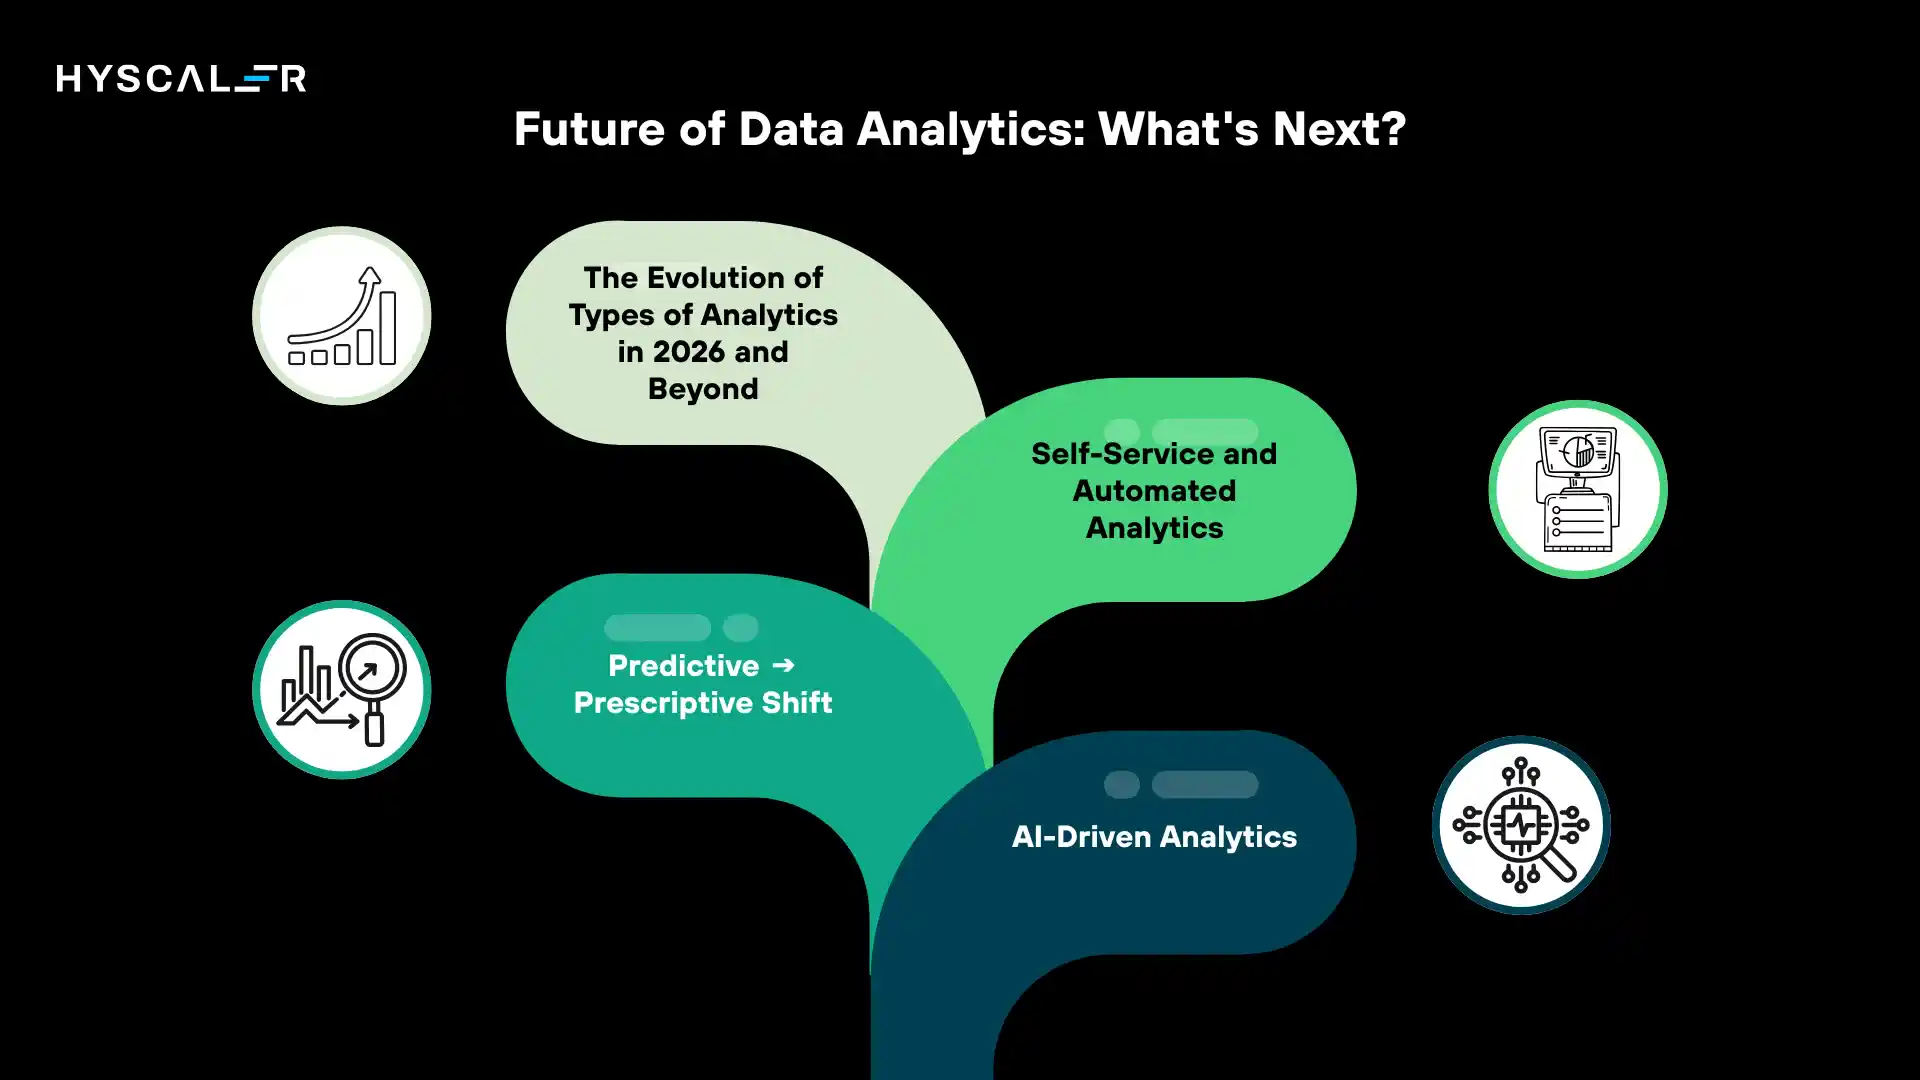
AI-Driven Analytics
Artificial intelligence is transforming analytics from a human-led activity to an AI-augmented collaboration.
AI systems increasingly handle data preparation, pattern recognition, and even insight generation, with humans focusing on strategy, context, and decision-making.
Predictive → Prescriptive Shift
Organizations are moving beyond simply predicting what will happen to automatically prescribing and executing optimal responses.
This shift represents analytics becoming embedded in operational systems, making real-time decisions without constant human intervention.
Self-Service and Automated Analytics
The technical barriers to analytics are falling.
Natural language interfaces allow business users to ask questions in plain English and receive visual answers.
Automated machine learning (AutoML) enables non-specialists to build predictive models.
Augmented analytics tools automatically surface insights without requiring users to know what to look for.
The Evolution of Types of Analytics in 2026 and Beyond
We’re seeing the emergence of:
- Continuous intelligence that combines real-time data processing with ongoing predictive analytics
- Federated analytics that analyze data across distributed sources without centralizing it
- Quantum analytics (still emerging) that may solve optimization problems currently beyond classical computing capabilities
- Edge analytics that process data on devices at the network edge rather than in centralized data centers
The boundaries between the traditional types of analytics are blurring as platforms integrate multiple capabilities into unified workflows.
The future belongs to organizations that can move fluidly from description to diagnosis to prediction to prescription, often within a single analytical session.
Conclusion: Turning Data into Actionable Insights
Understanding the different types of data analytics, from foundational descriptive methods that tell us what happened, through diagnostic approaches that explain why, to predictive models that forecast what’s coming, and finally to prescriptive systems that recommend optimal actions, empowers organizations to extract maximum value from their data assets.
The key is recognizing that these aren’t competing approaches but complementary capabilities that build upon each other.
You need to know what happened before you can understand why.
You need to understand why before you can accurately predict what’s next.
And you need reliable predictions before you can prescribe optimal responses.
The most successful organizations don’t ask “which type of analytics should we use?” but rather “which types of analytics do we need for each decision we make?”
They match analytical sophistication to decision importance, starting with simpler approaches for routine questions and investing in advanced analytics for high-stakes, complex decisions.
As data volumes grow and analytical tools become more powerful and accessible, the competitive advantage increasingly flows to organizations that can move quickly from data to insight to action.
The analytics journey is ongoing; wherever your organization is on that path, the next step is always to turn more data into more actionable insights, faster.
FAQs
What are the main types of analytics?
The main types of analytics are descriptive (what happened), diagnostic (why it happened), predictive (what will happen), and prescriptive (what should be done).
Additional types include exploratory, real-time, cognitive, and augmented analytics, each serving specific analytical needs.
What are the four types of data analytics?
The four primary types of data analytics are:
(1) Descriptive analytics, which examines historical data to understand past events;
(2) Diagnostic analytics, which investigates why events occurred;
(3) Predictive analytics, which forecasts future outcomes; and
(4) Prescriptive analytics, which recommends optimal actions.
Which type of analytics is best for decision-making?
The “best” type depends on your decision context. For routine operational decisions, descriptive analytics often suffices.
For understanding problems, use diagnostic analytics.
For anticipating trends, choose predictive analytics.
For complex, high-stakes decisions requiring optimization, prescriptive analytics delivers the most value.
Most organizations benefit from combining multiple types.
How do AI and analytics work together?
AI enhances analytics in several ways: automating data preparation and cleaning, identifying patterns humans might miss, building and refining predictive models, generating natural language explanations of insights, and recommending optimal actions through prescriptive analytics.
AI transforms analytics from a purely human activity to a collaborative human-AI process, making insights more accurate, timely, and accessible.