Table of Contents
Google Play Store statistics are crucial for app developers as they provide valuable insights into the performance and popularity of their apps. Developers can utilize these statistics to understand the lifecycle of their apps, from discovery to user engagement. By analyzing user feedback, ratings, and reviews, developers can improve their apps and respond to user concerns effectively.
Access to aggregated data through the Play Console allows developers to benchmark their app’s performance and make informed decisions to enhance user experience and grow their businesses. Understanding key variables like app downloads, revenue, and user engagement helps developers optimize their apps for success on the Google Play Store.
Moreover, Google Play Store statistics help developers track trends, such as the most popular app categories and the number of available apps, enabling them to tailor their app development strategies accordingly. By staying informed about the latest statistics and insights, developers can stay competitive in the app market and maximize their app’s visibility and success on the Google Play Store.
Top Google Play Store Statistics
Overview of the current number of apps on the Play Store
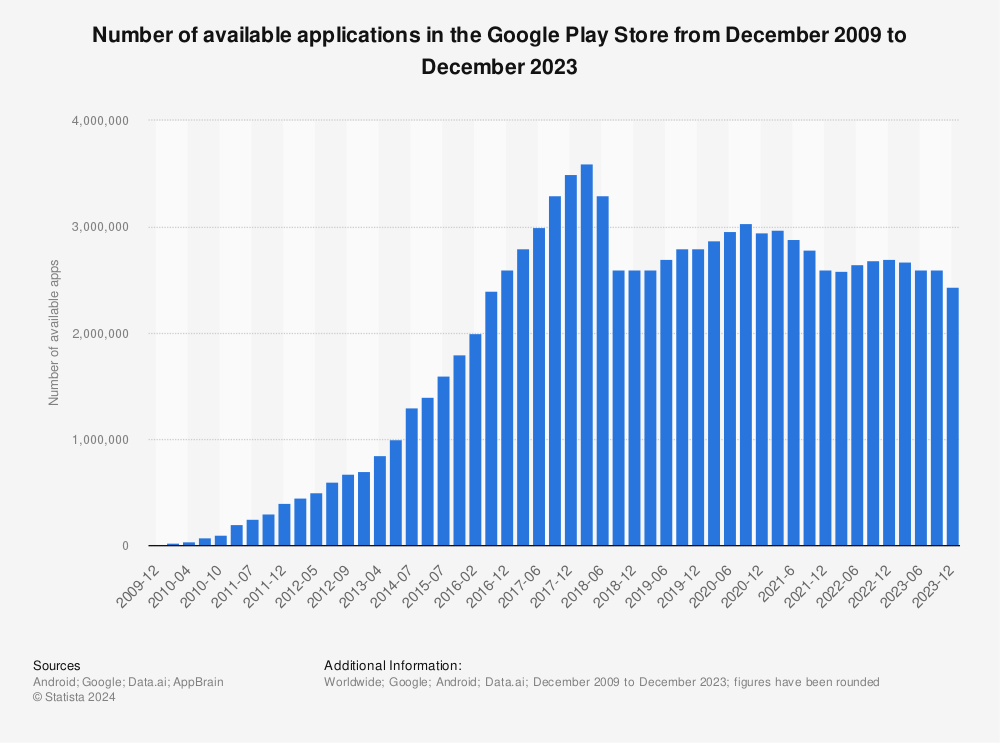
Find more statistics at Statista
As of the most recent data, the Google Play Store had a total of 2.43 million available apps. This vast ecosystem provides many opportunities for app developers to showcase their creations and reach a global audience of Android users. By leveraging the extensive reach of the Play Store, developers can tap into a diverse market and potentially achieve significant success with their apps.
Breakdown of app category distribution
Based on the latest statistics, the distribution of app categories on the Google Play Store is as follows:
- Gaming apps: These were the most popular category, accounting for 13.8% of available apps worldwide.
- Mobile education apps: Ranked second with a 10.47% share of available apps.
- Other categories: Combined, they made up 87.12% of the total available apps.
It’s important to note that these percentages represent the situation as of mid-2022, and the distribution may have shifted since then. The Google Play Store is a dynamic platform with categories constantly evolving as developers publish new apps and update existing ones.
Statistics on app download numbers and revenue generated
According to the summary of statistics for application download numbers and revenue generated on Google Play in 2024.
Google Play Store Statistics: App Download Numbers:
- Last year, Google Play received more than 113 billion app and game downloads.
- In 2023, the highest-grossing app on Google Play was Google One, a cloud storage service.
- Instagram was the most downloaded app on Google Play last year, with 521 million downloads.
Google Play Store Statistics: Revenue Generated:
- Consumers spent $47 billion on Google Play apps and games in 2023.
- In 2024, the Google Play Store is projected to bring in $58.1 billion from the sale of apps and games.
App developers can learn a lot about user engagement patterns, potential revenue streams, and the general performance of apps on the Google Play Store by examining these data. Developers can use this data to optimize their apps for success in the cutthroat app industry and to make well-informed strategic decisions.
Google Play Store Statistics: User Engagement Metrics

User engagement metrics are essential indicators that help app developers understand how users interact with their apps and measure the level of user involvement and activity. By tracking user engagement metrics, developers can assess the effectiveness of their app in capturing and retaining users’ interest.
These metrics provide valuable insights into user behavior, preferences, and overall app usage patterns, enabling developers to make data-driven decisions to optimize their apps for improved user engagement and satisfaction.
Average time spent by users on apps
By 2024, mobile app users will have been using smartphones for 4.37 hours a day on average. This is a long duration, demonstrating the pervasiveness of smartphones and apps in our daily lives.
Different countries have different average amounts of time spent on smartphones—in some, users use them for up to six hours a day. Mobile apps are essential for social media, shopping, entertainment, and communication for a large number of people worldwide.
Percentage of users who make in-app purchases
An estimated 5% of users will have made in-app purchases by 2024. The users who are prepared to pay for extra features, content, or subscriptions inside apps are reflected in this percentage. The bulk of these users are located in continents like Europe, North America, and Asia.
It’s interesting to note that 48.2% of all mobile app revenue comes from in-app purchases, which make up a sizeable portion of earnings. The significance of in-app purchases as a revenue stream for app developers and companies is highlighted by this trend.
Retention rates of apps over time
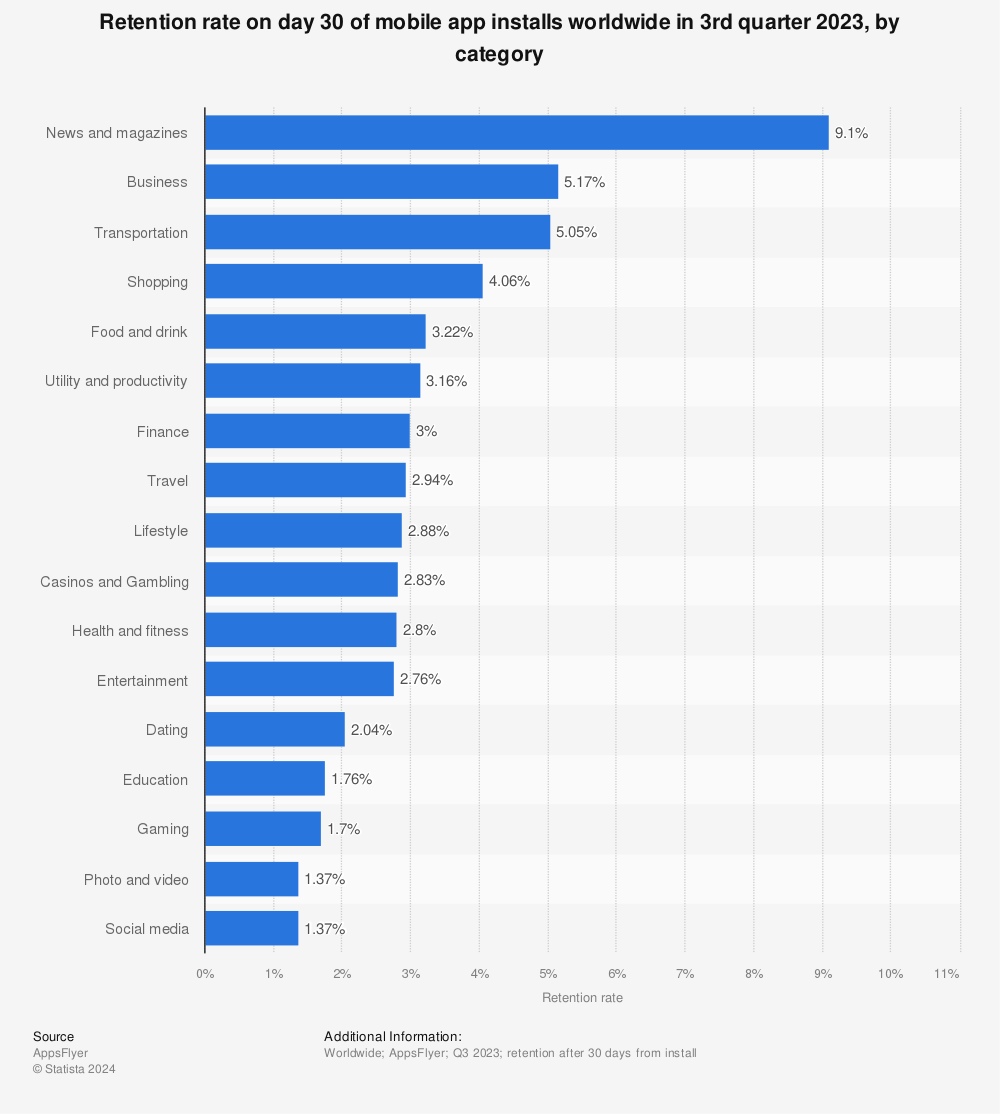
Find more statistics at Statista
App retention rates are an important metric for assessing user engagement over time. The following is a breakdown of app retention rates by category as of the third quarter of 2023.
- After 30 days, the retention rate for news and magazines is more than 9%.
- After 30 days, educational apps have a retention rate of less than 2%.
- Entertainment apps have a 30-day retention rate of around 3%.
- Shopping apps have a 4% retention rate one month after installation.
Overall, app retention rates are low, with more than 90% of users abandoning an app before it reaches 30 days. Popular apps and games, on the other hand, can have higher retention rates because of their engaging content and frequent updates.
In general, average app retention on Android was 21.1% on day one but had dropped to 2.1% by day 30. On iOS, the average app retention rate was 23.9% on day one, dropping to 3.7% by day thirty. These statistics demonstrate that app developers face a significant challenge in retaining users, emphasizing the importance of creating valuable and engaging content to maintain user interest over time.
Google Play Store Statistics: Device and OS Trends
Popularity of Android devices for app downloads
Android devices are extremely popular for app downloads, far outpacing competitors. Here are some key points regarding the popularity of Android devices:
- Global Reach: Android is the world’s most popular operating system, with over three billion active users across 190 countries.
- Market Share: Android has a market share of more than 85% in Brazil, India, Indonesia, Iran, and Turkey.
- App Downloads: Android users download over 2.8 million apps per day, more than doubling the number of apps downloaded by iPhone users.
- Google Play Store: Android’s app store is the world’s largest, with nearly 2.6 million apps available for download.
These statistics demonstrate Android’s dominance in the mobile market and its importance in the app economy. The platform’s widespread adoption across regions and demographics makes it a hub for app downloads and user engagement.
Google Play Store Statistics:: Distribution of Android OS versions among users
Source: StatCounter Global Stats – Android Version Market Share
As of February 2024, the distribution of Android OS versions among users globally is as follows:
- Android 13 is currently the market leader, with a 29.16% share.
- Android 12 follows with a market share of 17.17%.
- Android 11 is next, with a market share of 16.64%.
- Android 14: In the United States, Android 14 surpassed previous versions, accounting for more than 37.2% of all mobile Android devices.
These figures show that users quickly adopt the most recent versions of Android, indicating that developers are constantly updating and improving the platform. It also demonstrates the Android platform’s versatility and adaptability, which continues to attract a large number of users worldwide.
Google Play Store Statistics: Impact of device compatibility on app performance
Device compatibility has a large impact on app performance. Here’s a summary of key points about this.
- User Experience: Compatibility testing ensures that an app functions properly across multiple devices, which is critical for maintaining a consistent user experience.
- Usability Issues: Identifying and addressing usability issues early in the development process can improve the user experience while also reducing production costs.
- Performance Metrics: Proper compatibility testing can improve app usage metrics by ensuring that the app works well across multiple device and browser combinations.
- Developers face challenges due to the variety of operating systems, interfaces, and system calls, which can impact app performance across platforms.
- Optimization: Compatibility testing is critical for improving the app’s scalability, usability, and stability across various platforms and operational scenarios.
In essence, ensuring that an app works with a variety of devices and operating systems is critical to its success. It affects not only how the app works, but also how users perceive it, which can have an impact on retention and revenue.
Google Play Store Statistics: Regional Insights

Geographic breakdown of app download
The geographic distribution of app downloads in 2024 is quite diverse, reflecting the global reach of mobile technology. Here’s an overview based on the most recent data.
- Asia-Pacific: This region leads in app downloads, accounting for more than 40% of new app users. The increasing affordability of Android devices and expanded mobile coverage are driving the growth.
- North America: With a high smartphone penetration rate, North America remains a significant market for app downloads, particularly for high-revenue apps.
- Europe has a well-established user base and prefers a diverse range of app categories, resulting in strong app download performance.
- Latin America: Rapidly growing smartphone adoption in Latin American countries contributes to an increase in app Importance of leveraging these insights for app success.
- Africa: Despite being a smaller market than other regions, Africa is seeing a steady increase in app downloads due to improved internet access and smartphone availability.
These trends show that, while developed markets such as North America and Europe have a consistent demand for apps, emerging markets, particularly in the Asia-Pacific region, are rapidly expanding and account for a sizable portion of global app download activity.
This emphasizes the importance of taking geography into account when developing and marketing mobile applications.
Google Play Store Statistics: Popular app categories in different regions
The popular app categories on the Google Play Store may vary by region. Here are some insights based on the data available:
1. United States: In the United States, popular app categories on the Google Play Store include gaming, entertainment, social networking, and productivity apps.
2. China: In China, app categories such as mobile gaming, e-commerce, and social media are among the most popular on the Google Play Store.
3. Europe: In European regions, app categories like travel, navigation, and lifestyle apps are popular among users on the Google Play Store.
4. Latin America: In Latin American countries, app categories such as music, video streaming, and communication apps are commonly popular on the Google Play Store.
By analyzing regional trends in app categories, developers can tailor their app offerings to cater to the specific preferences and interests of users in different regions, thereby maximizing their app’s visibility and success in the global app market.
Google Play Store Statistics: Localization strategies based on regional preferences
Localization strategies based on regional preferences play a crucial role in the success of mobile apps in different markets. By understanding the popular app categories in various regions, developers can tailor their localization efforts to align with regional preferences effectively. Here are some localization strategies based on the provided information:
United States:
- Focus on optimizing app content and user interface for English-speaking users.
- Highlight gaming, entertainment, social networking, and productivity features that resonate with users in the United States.
China:
- Translate app content into Mandarin and consider integrating popular Chinese payment methods.
- Emphasize mobile gaming, e-commerce, and social media functionalities to appeal to Chinese users.
Europe:
- Localize app descriptions and marketing materials in multiple European languages.
- Highlight travel, navigation, and lifestyle features that cater to the preferences of European users.
Latin America:
- Translate app content into Spanish and Portuguese to reach users in Latin American countries.
- Promote music, video streaming, and communication functionalities that are popular among Latin American users.
By implementing these localization strategies based on regional preferences, developers can enhance user engagement, increase app downloads, and establish a strong presence in diverse markets worldwide.
Conclusion
In conclusion, app developers can benefit significantly from analyzing key Google Play Store statistics to optimize their app development strategies and enhance their app’s success. By understanding app category distribution, app download numbers, and revenue generated on the platform, developers can make informed decisions to meet user demands effectively and maximize their app’s visibility and performance in the competitive app market.
Leveraging these insights allows developers to tailor their apps to align with regional preferences, optimize user engagement, and drive app downloads. By staying informed about the latest trends and statistics on the Google Play Store, developers can position their apps for success, increase revenue generation, and establish a strong presence in diverse markets worldwide.
Overall, by utilizing the valuable insights provided by Google Play Store statistics, app developers can enhance user satisfaction, drive app growth, and ultimately achieve success in the ever-evolving app ecosystem.